Propylene: picking the winners and losers
Tracking asset economic performance through the propylene downcycle
2 minute read
Catherine Tan
Principal Analyst, Asia Olefins

Catherine Tan
Principal Analyst, Asia Olefins
Catherine is responsible for Wood Mackenzie's ethylene and propylene analysis in Asia.
Latest articles by Catherine
-
Opinion
Ethylene: global carbon contributor
-
Opinion
Part 1: unlocking the value of refinery-petrochemicals integration
-
Opinion
Propylene: through the downcycle and beyond
-
Opinion
Propylene: picking the winners and losers
The propylene industry is facing a downturn.
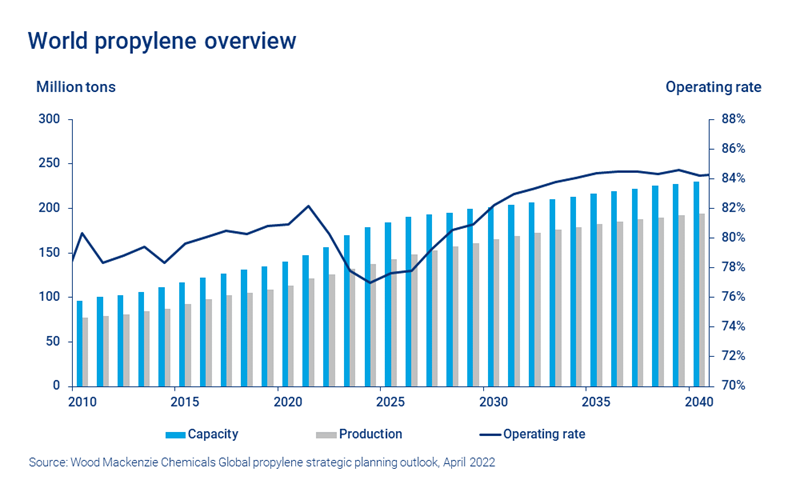
Between 2022 and 2026, we expect a surge in capacity that will exceed demand growth.
Much of the capacity boom will be driven by China’s massive investments into steam crackers and on-purpose technologies – such as propane dehydrogenation units (PDHs) – which will flood the market.
The capacity explosion will peak in 2023, when 13 million tonnes of capacity will be added in a single year: double annual demand growth.
As a result, industry operating rates will hit the bottom in 2024.
There will be winners and losers through the downcycle. How can the winners be identified? And what decisions will operators need to make in order to help them improve profitability through the downturn and beyond? Fill in the form for a complimentary insight, and read on for an introduction.
Learn about the similar dynamics that are at play in the polypropylene market by reading our insight ‘Overcapacity puts pressure on polypropylene markets’.
To understand economics, we need to look beyond the industry cycle
Simply tracking the propylene industry’s ups and downs is not enough to predict profitability.
While the industry will hit the bottom in 2024, different regions and technology types will reach a low at different points in the cycle.
For example, in Asia, naphtha cracker-based light olefin margins will bottom out in 2022 to 2023, while PDH margins will reach their lowest in 2024. A similar trend is expected in Europe, although the continent will experience higher propylene prices and margins throughout most of the 2020s.
Many producers will need to rethink their survival strategies
Across the industry, capacity rationalisations will be inevitable, especially for higher-cost, inefficient assets. Some producers will feel the squeeze on their margins.
A more nuanced understanding of asset-level costs will help producers to identify assets that are at risk of closure during the downturn. Variables to consider include relative feedstock costs, co-product markets and location.
Using our newly developed propylene and polypropylene asset benchmarking tools, we are able to analyse and compare assets on an individual level, identify strengths and weaknesses and predict future performance.
Which regions will be most exposed to the downcycle?
More than 60% of global propylene capacities are located in Asia. By 2024, the region’s share will increase to 68%.
Our analysis indicates that higher cost assets most at risk during the downturn are predominantly located in that region.
However, every asset’s cost position can change over time. A comparison of propylene asset costs from 2022 to 2024 shows that general cost levels will shift lower in 2024 as energy prices abate. Steam cracker costs should shift to the right of the cost curve as co-product credit contributions decrease.
Fill in the form at the top of the page to access the complimentary insight.
Gain a clear view of assets that are most at risk of rationalisation
This analysis draws insight from our propylene asset benchmarking tool, which tracks and compares individual cost components to help operators make decisions about how to improve profitability through market volatility.
Learn more about how to sort the winners from the losers as the downcycle approaches. And read more about the dynamics at play in the propylene and polypropylene market in our insights ‘Propylene: Through the downcycle and beyond’ and ‘Overcapacity puts pressure on polypropylene markets’.

