Offshore wind: policy frameworks decide who wins – but not when
Policymakers cash in, consumers pay out and asset owners look to balance risk with reward as offshore wind power market trends flip
4 minute read
Finlay Clark
Principal Research Analyst, Global Offshore Wind

Finlay Clark
Principal Research Analyst, Global Offshore Wind
Finlay plays a pivotal role in our comprehensive coverage of the offshore wind supply chain.
Latest articles by Finlay
-
Opinion
Offshore wind: policy frameworks decide who wins – but not when
-
Opinion
Change is coming to the offshore wind towers sector
Srinivasan Santhakumar
Principal Research Analyst, Offshore Wind

Srinivasan Santhakumar
Principal Research Analyst, Offshore Wind
Srinivasan is a principal analyst with a particular focus on asset valuation, LCOE forecasts and market research.
Latest articles by Srinivasan
-
The Edge
How higher interest rates could hold up energy transition investment
-
Opinion
Elevated subsidies enable offshore wind to end 2023 on a high note
-
Opinion
Offshore wind: policy frameworks decide who wins – but not when
Offshore wind is coming of age. With the world’s sights set firmly on net zero goals, competitors are flocking to invest, while governments are providing public policy support. In the next decade, US$1 trillion is set to flow into offshore wind. Everyone – from legacy energy providers to Big Oil – is making moves in this space.
Despite being the global leader, the European offshore wind industry is still in its infancy and the largest opportunities lie ahead. In 2021, offshore wind supplied just 9% of annual power generation in the largest five offshore wind markets in the region. It did, however, surpass onshore wind generation in three of the top five markets: the UK, the Netherlands and Belgium.
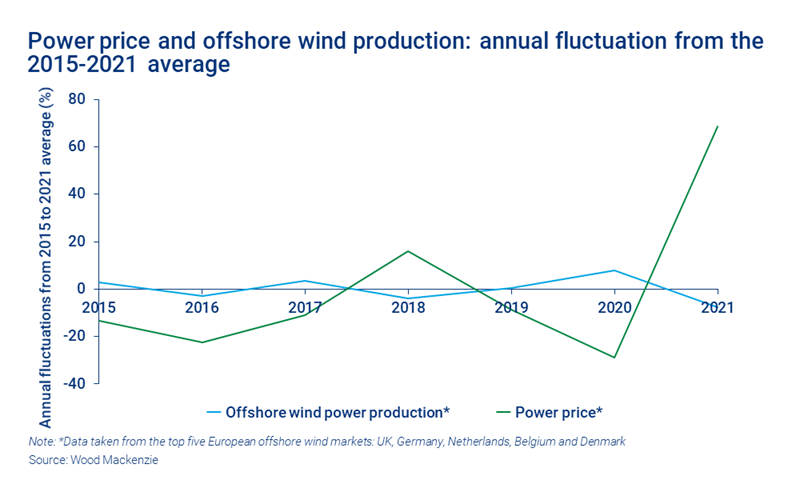
Growth is one thing, performance is another. Comparing the European sector’s performance in 2020 against 2021 highlights the impact of the factors that the sector cannot control, wind speeds and power prices. While offshore wind production soared by 21% in 2020 year-on-year, a drop in demand driven by the global pandemic exposed the need for grid flexibility as capture prices fell to record lows.
In contrast, despite a year-on-year fall in total production in 2021, the reverse occurred. Offshore wind revenues hit record highs as power prices soared.
Drawing data and insights from our Offshore Wind Service, our recent report, 2021 Offshore wind power production and revenue assessment unpacks some of the dynamics that have contributed to these highs and lows. Fill in the form for a complimentary extract or read on for an overview of the key themes.
Energy capture prices and production cannot be controlled, but assets can be balanced through support schemes
The revenue profile, which determines the level of exposure to power price volatility, varies significantly across Europe. Revenue profiles range from fixed revenues per megawatt hour (MWh) which are not exposed to power price changes – such as Feed-in tariff (FiT) or contract for difference (CfD) – to mechanisms where asset owners get a premium on top of the capture price – an example being green certificates or renewables obligation certificates (ROCs). The latter are therefore exposed to changes in power prices.
The annual revenue of a wind farm varies significantly, as both market conditions and offshore wind power production change over time. By understanding such dynamics, asset owners can diversify their portfolio not only within this growing offshore wind market but also better position offshore wind in their wider renewables portfolio – and get rewarded accordingly.
While all offshore wind project revenues are impacted by the volume of power produced, the year-on-year variance in wind speeds is far less volatile than the changes in power price. Subsequently, the largest share in a project’s revenue risk stems from the extent of exposure to power price, and the support schemes in place.
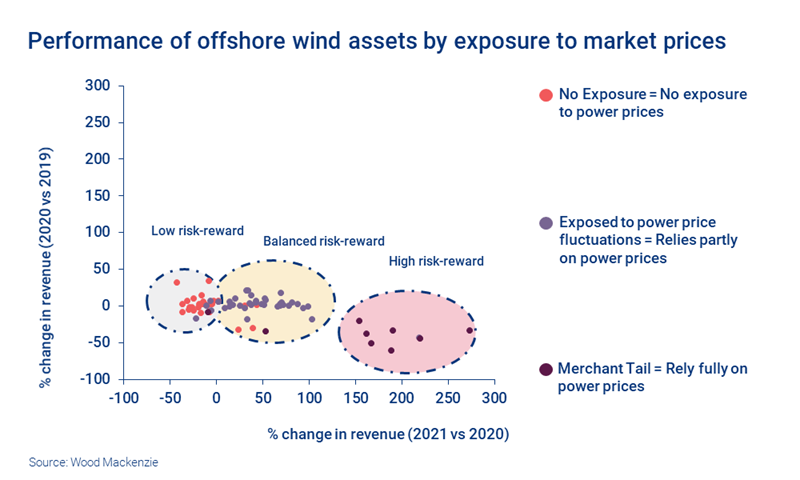
Broadly, in the last couple of years, balanced risk-reward type projects (green certificates and ROCs) have done well. Revenue floors in the green certificate scheme have protected the project’s revenue falling to the bottom in low-wind years, and the ability to capture market price upside (2021) saw the revenues rise to peak.
High risk-reward projects, such as those operating on a merchant tail, benefitted from spiralling power prices in 2021. However, low power prices, like those in 2020, will hit owners’ annual revenues.
Lastly, low risk-reward type projects, such as contract for differences (CfD) and feed-in tariff (FiT) scheme projects, only face production risks, since lost production equates to lost revenue for them.
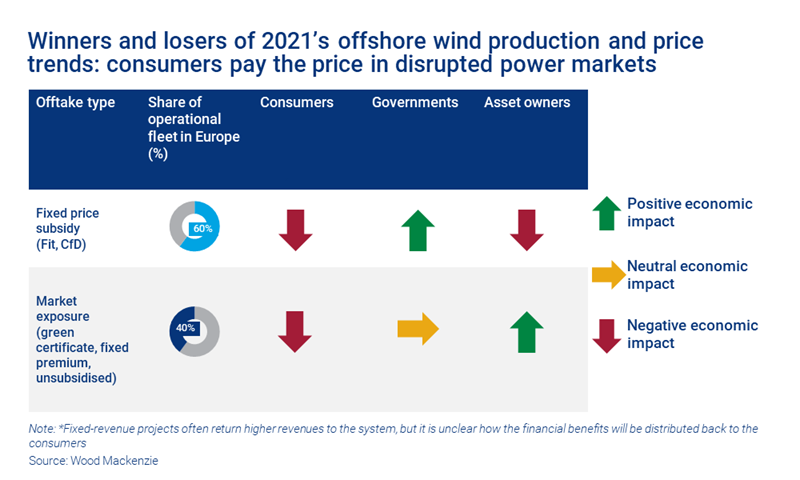
- Consumers: Spiralling power prices have hit consumers through record high energy bills. High gas tariffs and a return of power demand post Covid-19 spiked European prices by as much as 220% in 2021. This is severely impacting consumers. In H1 2022 power prices have continued to climb across Europe, indicating high energy bills will continue troubling consumers unless governments intervene.
- Governments: Governments were the key beneficiary with 60% of operating assets in Europe being contracted at fixed prices. Their subsidy premium pay-out therefore declined year-on-year with the increased market prices. In 2021 governments paid 36% less in subsidies per MWh compared to 2020.
- Offshore wind asset owners: Despite being on the receiving end of project revenues, offshore wind owners were not the biggest winners in 2021. High revenues were largely offset by the dip in energy production and limited exposure to power markets.
What does this mean?
Since 2016, the offshore wind industry has talked about the ‘record low subsidy bids’ across offshore wind tenders. However, 2021 and 2022 have shown us that it is not just the level of the bids that is of significance, but also the structure of the mechanism.
The reason for this is that there will always be uncertainty about future wind speeds and power prices. The structure of the mechanism will determine who will win and lose under different market conditions. That’s also why the current discussions around capping or fixing revenues from projects is important.
There are myriad support mechanisms available in offshore wind. This offers opportunities for investors with different appetites for risk, and allows for asset owners to diversify their portfolios despite the comparatively small size of the offshore wind sector. Moreover, with the rise of corporate power purchase agreements (PPAs) and the emergence of storage and green hydrogen technologies, asset owners are now also able to change the asset’s vulnerability to changes in power prices and wind speeds respectively.
Discover more about how Europe’s offshore wind industry’s performance has evolved
Fill in the form at the top of this page to download a complimentary extract from our insight, Offshore Wind Power Production and Revenue Assessment, and track the asset-level numbers for revenue, capacity factors, revenue and more.


