Changing price patterns in the European power markets
Intraday and Day Ahead market dynamics underline the value of real-time data
4 minute read
Błażej Radomski
Principal Analyst, Europe and Japan Power Markets

Błażej Radomski
Principal Analyst, Europe and Japan Power Markets
Latest articles by Błażej
-
Opinion
Changing price patterns in the European power markets
-
Opinion
Why real-time data could be the key to successful power trading strategies
This has been an eventful year for the European power markets. A number of forces have contributed to shifts in price behaviour. For one thing, price levels of electricity and the fuel complex had already been growing as we started the year. The difficult hydrological situation in the Alps, Iberia and south eastern Europe, the war in Ukraine, broken gas and coal delivery chains and widespread uncertainty have all since made their presence felt.
So, how are these factors influencing the markets, and what does it mean for trading strategies? We explored the changing landscape in European power volumes and prices: H1 2022 in review. Fill in the form for a complimentary extract, or read on for an introduction highlighting the situation in Germany.
All figures in this article are based on power prices achieved at the European Power Exchange (Epex Spot).
Price growth in Germany’s day ahead and intraday markets
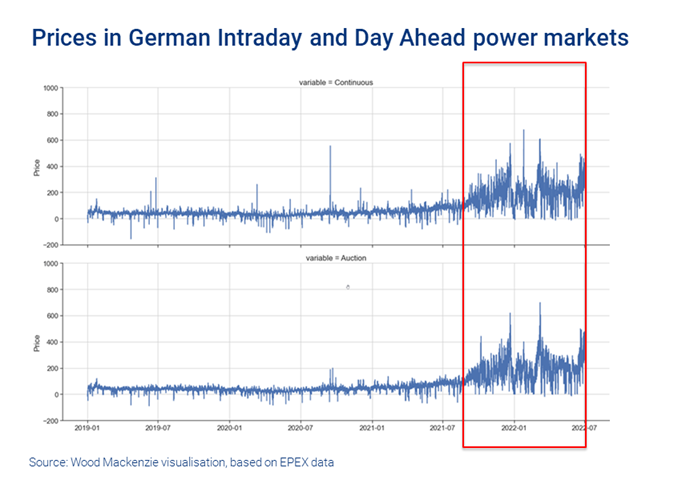
Electricity prices in the German Day Ahead (DA) auction and Intraday (ID) continuous electricity markets have been rising since autumn 2021. We have also seen a clear growth in volatility, with an increasing variation-band of hourly prices recorded every day. This new phase is highlighted in red in the chart below.
Closer investigation of the price differences between the corresponding products (hour of the day) traded in the DA and ID markets delivers significant findings.
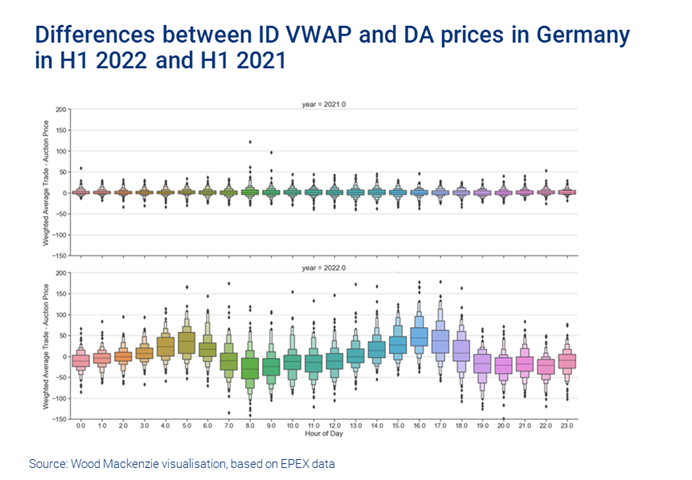
The visualisation below presents two letter value plots. On the Y-axis is the price difference between the volume-weighted average price (VWAP) in the German hourly ID market and the DA auction price. The price differences are plotted for all 24 hours individually. The comparisons were made for the first half (H1) of the current year and of 2021. The Y-axis values were fixed to the range €150-200 for both years, for better comparability of the price differences.
So, what does this visualisation tell us? Price patterns changed massively during H1 2022 compared to the year before. We can see that:
- The price differences between the DA and ID markets show significantly wider distribution in 2022.
- Outliers reach more extreme values.
The average price difference for all hours of the day shows an interesting pattern, too. The midline of each main rectangle (representing the median of all observations) indicates ID prices being systematically higher than the DA prices during the early morning and evening hours. The situation flips during offpeak I and II and during hours around noon.
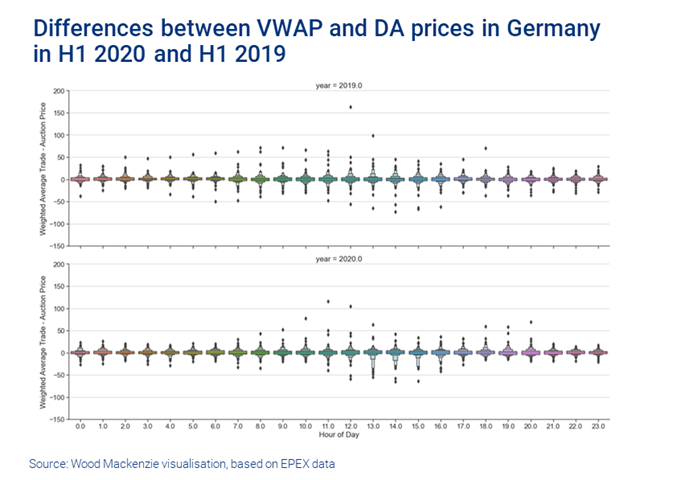
We didn’t see this clear pattern in previous years. The chart below depicts the same price differences, but comparing H1 2020 with H1 2019. The results for each were similar to 2021, but show a stark difference to 2022.
Increased price levels and volatility along different power markets have been observed since 2021. However, the changes in price differences between the ID and DA markets pose some interesting questions, which could impact trading behaviour:
- 2022 figures show a VWAP systematically above the corresponding DA price for some hours, and systematically below for some others. Have market players considered this in their trading strategies?
- Does this allow speculative trading?
- Does this type of systematic deviation indicate a certain inefficiency of the market?
- Will the market adjust to the obviously new situation and ‘neutralise’ these price differences, and how long could that take?
- Does increased volatility open new trading opportunities?
- How can this volatility be effectively utilised?
- What tools and additional information are necessary?
The value of real-time data for successful trading strategies
The answer to these questions may lie in real-time generation data.
The power markets remain fundamentally driven by the fact that the electricity demand needs to be satisfied by production in a given unit of time. Storing electricity is not possible on a macro scale, so demand and production must be in sync in order to maintain the 50 Hz frequency in the grid.
As we move along the curve closer to delivery (from the DA towards the ID perspective), the fundamentals are changing. Quantifying the change between the power balance situation assumed during spot nominations and what is validated later, during the ID trading phase, is essential to analysing price differences.
Real-time data can therefore help to identify sources of imbalance in the system and support successful intraday trading strategies.
Get a closer look at the European power markets
Whether you’re focused on the short, mid or long-term horizon, our EPSI platform delivers actionable insights for European power markets. And you can access real-time power plant output and transmission flow data via PowerRT Europe.
For a closer look at the year to date, read European power volumes and prices: H1 2022 in review. Fill in the form at the top of the page for a complimentary extract with charts on:
- Average day-ahead power prices in Europe
- Year-on-year changes in power demand
- Supply mix changes
- And more.


