


How low-cost US natural gas spurs global LNG opportunities
1 minute read

Eugene Kim
Research Director, Americas Gas

Eugene Kim
Research Director, Americas Gas
Eugene Kim is a Research Director on Wood Mackenzie’s Americas Gas Research team.
Latest articles by Eugene
-
Opinion
US gas prices slide as storage expectations tighten: what it means for summer 2026
-
Opinion
North America gas: 4 things to look for in 2026
-
Opinion
How LNG and power are shaping US gas pipeline development
-
Opinion
Summer 2025 wrap-up: gas generation falls despite higher power loads
-
Opinion
Permian basin gas outlook: Eiger Express FID adds to outbound build momentum
-
Opinion
LNG Canada makes historic first export shipment
The US shale revolution is one of the gas industry’s most remarkable stories. As well productivity and gas-to-oil ratios dramatically increased, the US emerged as the largest gas producer in the world – now comprising 24% of total global production.
And as the US low-cost resource base expands and production growth continues, it’s also helping to spur demand and create LNG opportunities, further strengthening North America’s market position.
Massimo Di Odoardo, Wood Mackenzie VP of global gas and LNG research, comments on LNG demand growth opportunities.
The scale of the shale revolution
The impact of the shale revolution is global. In 2001, US shale gas comprised less than 6% of total US production. With the introduction of new horizontal drilling and fracking techniques, vast and previously uneconomic oil and gas reserves were unlocked.
By the start of 2014, more than 50% of US gas production was from shale. Today, it’s 68%.
Shale technology advancements have not only greatly improved the recoverable volumes of gas, but also driven lower breakeven prices. The flipside? As these low-cost US gas resources were rapidly produced, infrastructure bottlenecks resulted in negative spot prices, which hurt producers’ profits.
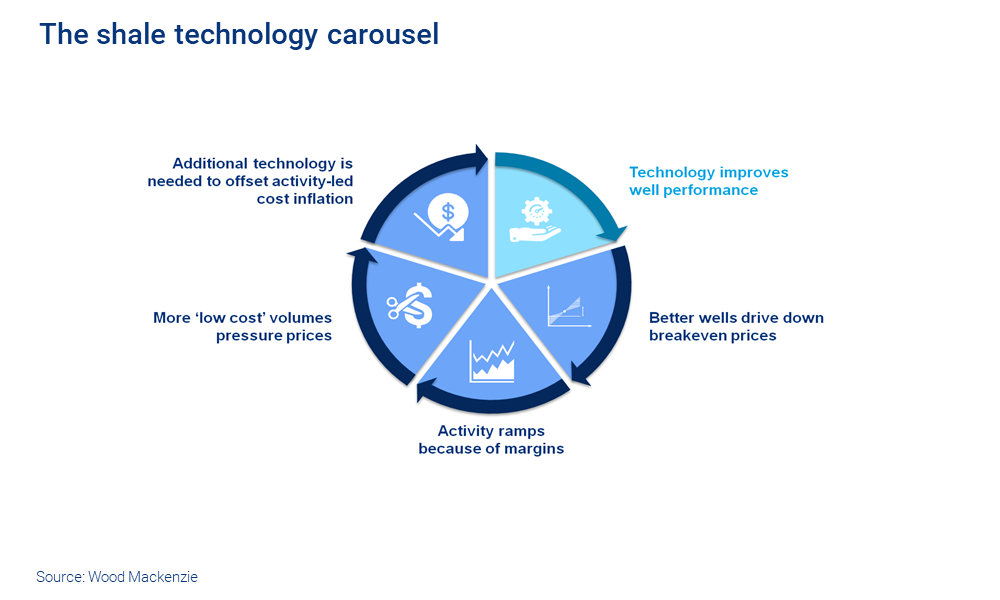
How the shale technology carousel expanded the low-cost resource base
Increased activity levels created a notable cycle. More abundant, lower-cost supply puts pressure on gas prices, which drives technology advancements.
This “shale technology carousel” has turned many times. We currently estimate that about 80% of the US Lower 48 gas resources remaining in undrilled locations now have breakeven costs under US$3/mcf.
The shale revolution has also propelled the US into the top spot as the largest gas producer in the world, with output gains set to continue. We forecast continued production growth to nearly 124 bcfd by 2035.
Growing gas demand also spurs opportunities
Since 2010, US gas demand has increased by about 43% to 95 bcfd in 2019. Increased regulation and opposition to coal and nuclear power plants led to early retirements, with the gap largely filled by gas plants.
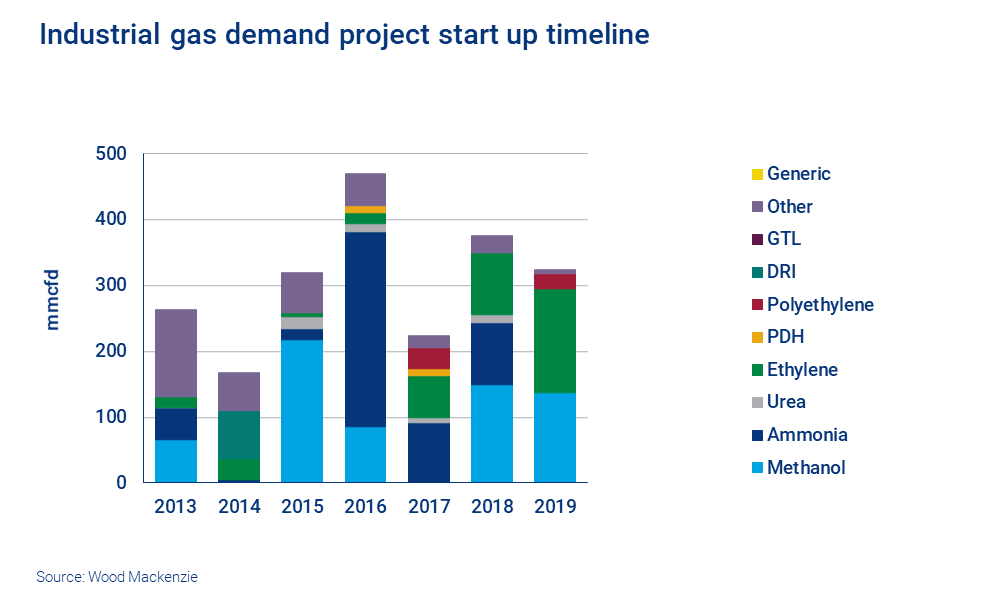
US industrial demand also rose. 2010 to 2019 (including estimates for the remainder of the year) saw a 4.5 bcfd increase, to 23.2 bcfd.
And the domestic market is far from the only source of demand. The competitive US gas price means international exports are also rising. Pipeline exports to Mexico increased 4.6 bcfd to 5.2 bcfd from 2010 to 2019, while LNG volumes from the Lower 48 states reached 5.3 bcfd, initially from plants in Louisiana and Maryland.
Longer-term view: gas market growth to 2035
Looking ahead, we see continued demand growth and new project developments, though construction delays are taking a toll. Now gas pipelines to key demand centres in Mexico are in limbo, and LNG terminal delays are impacting domestic pricing.
LNG exports will be key. As the global market tightens, US LNG exports will reach near 10 bcfd as facilities push near full utilisation by the end of 2022.
By 2035, we forecast US LNG exports to reach 23.5bcfd. Mexican gas exports also continue to grow by 2.1 bcfd, reaching 7.3 bcfd by 2035.
And while US gas penetration into the power market will be limited by renewables absorbing long-term load growth, we expect industrial demand to continue to attract new project developments and forecast growth of 4.2 bcfd to 27.4 bcfd by 2035.
Join us at Gastech and meet the team in Houston. We'd love to meet you - visit this page to find out how to arrange a one-on-one meeting.