Green hydrogen: what the Inflation Reduction Act means for production economics and carbon intensity
Annual matching requirements for new IRA tax credits could kick-start economically competitive green hydrogen production – though the carbon intensity implications are complex
6 minute read
Melany Vargas
Vice President, Head of Hydrogen Consulting

Melany Vargas
Vice President, Head of Hydrogen Consulting
Melany has extensive experience solving strategic problems for clients across the global energy value chain.
Latest articles by Melany
View Melany Vargas's full profileKara McNutt
Vice President, Head of Americas Power and Renewables Consulting

Kara McNutt
Vice President, Head of Americas Power and Renewables Consulting
Kara leads Wood Mackenzie’s Americas Power and Renewables Consulting team based in Boston.
Latest articles by Kara
-
Opinion
Green hydrogen: what the Inflation Reduction Act means for production economics and carbon intensity
-
Opinion
Will carbon policy push refiners to the brink?
Chris Seiple
Vice Chairman, Energy Transition and Power & Renewables

Chris Seiple
Vice Chairman, Energy Transition and Power & Renewables
Chris brings more than 30 years of global power industry experience to his role.
Latest articles by Chris
-
Opinion
eBook | Navigate power market uncertainty with confidence: the essential guide to profitable energy investments
-
Opinion
eBook | Power surge: can US electricity supply meet rapidly rising demand?
-
Opinion
eBook | Historic opportunities and complex challenges in a volatile world
-
Opinion
The 2025 US power market outlook
-
The Edge
How gas could displace renewables in meeting surging US data centre demand
-
Opinion
Uncertainty dominates the 2025 US power outlook
Hydrogen can play a critical role in the United States’ journey to net zero as a low-carbon fuel to support the decarbonization of hard-to-electrify energy demand sectors. The Inflation Reduction Act’s 45V production tax credit is meant to incentivize the deployment of low-carbon hydrogen, accelerating the learning curve and enabling costs to decline.
The highest tax credits, for the lowest carbon hydrogen reach up to US$3/kg. However, the rules around the way the carbon intensity (CI) of hydrogen will be measured, and the potential allowance of mechanisms to offset emissions, such as Renewable Energy Credits (RECs), are still under development. These rules, which are currently being defined by The Treasury Department, could have significant implications for the economic competitiveness of electrolytic or green hydrogen projects and the CI and absolute emissions of power grids.
As a result, hydrogen CI temporal matching has become a very hot topic in recent months in industry and political circles. The debate largely centers around electrolyzers that rely on grid electricity for all or part of their energy needs. Some organizations would like to see green hydrogen developers prove they are consuming 100% renewable power by matching their electrolyzer’s electricity consumption to renewable-power generation on an hourly basis. Others are arguing that these requirements will limit the economics and deployment of green hydrogen projects.
Given the broad set of perspectives on the topic, Wood Mackenzie set out to test the impact of grid-connected green hydrogen production. We looked at the impacts on the CI of power grids and hydrogen production, as well as electrolyzer capacity factors under a scenario allowing for RECs versus an hourly matching policy where an electrolyzer’s load would match corresponding renewable energy generation profiles. We leveraged our proprietary power market and levelized cost of hydrogen (LCOH) models to analyze these impacts in two unique power markets: ERCOT South and WECC Arizona.
In each market we evaluated the impact of adding 250 MW of electrolyzer capacity to the grid and assumed hydrogen deployment occurred with commensurate renewable build-out to support the load of the electrolyzer and the generation of local RECs.
This analysis was then benchmarked against our based case hourly generation, pricing and emissions data for each market.
Green hydrogen economic implications are clear
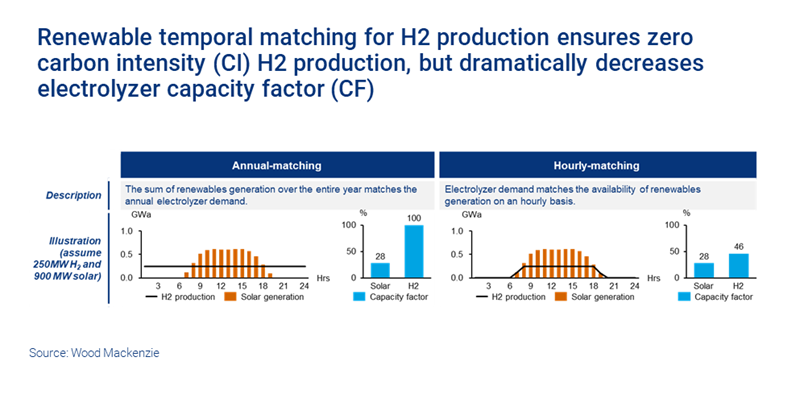
Our analysis found that an annual matching scenario that allows RECs as an offsetting mechanism, can result in net zero CI and economically competitive green hydrogen production.
Conversely, hourly matching requirements, depending on their implementation, could result in unfavorable economics for green hydrogen adoption, by limiting operating hours to those when renewable resources are available, ultimately reducing the electrolyzer capacity factor. The result is that operators must distribute their costs over a smaller volume of hydrogen production, requiring a higher price to recover their capital for each kilogram of hydrogen sold.
With a direct hourly matching of renewable generation sources, our analysis shows that an electrolyzer capacity factor ranging from 46-72% leads to LCOH increases of 68%-175% relative to an annual matching scenario that allows operators to reach a capacity factor of 100%. In the WECC Arizona market, the results are an LCOH (with a US$3/kg tax credit applied) increasing from about US$2/kg in 2025 and US$1.50/kg in 2030, in an annual matching scenario, to about US$4-5/kg in an hourly matching scenario.
This degree of cost increase could delay the ability to produce green hydrogen at cost parity to lower-cost, blue or grey hydrogen, ultimately hindering the economic competitiveness and adoption of both grid-connected and 100% renewable green hydrogen as a low-carbon fuel.
Conversely, the modelling of an annual matching scenario shows that an electrolyzer running at a 100% capacity factor, under an annual matching regime that allows for REC offsets, could achieve economics below US$2/kg by 2025, and below US$1.50/kg in 2030 in both markets.
This range of economics is in line with blue hydrogen parity and supportive of the DOE targets for green hydrogen LCOH of US$2/kg by 2025 and US$1/kg by 2030.
The implications for the carbon intensity of hydrogen production are more complex
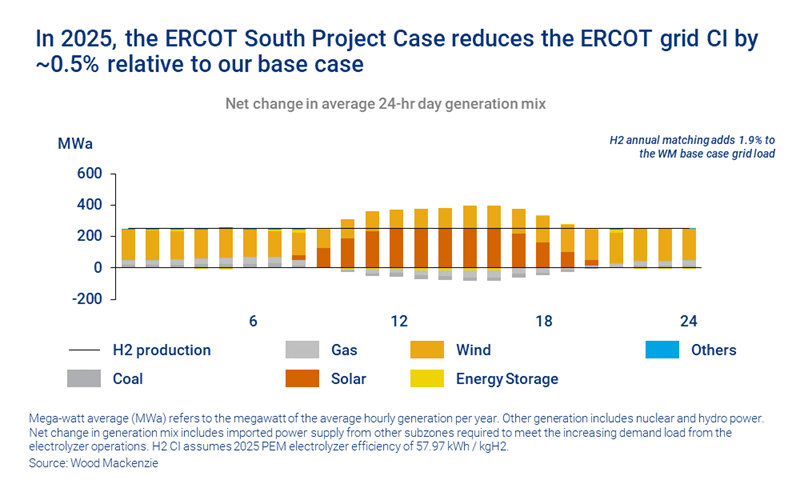
While the economics are more favorable in the annual matching scenario, there are a series of emissions and carbon intensity trade-offs to consider. In the annual matching case, the electrolyzer relies on grid electricity for 19-35% of electricity requirements. Although during certain hours the grid must draw more from thermal energy sources, the incremental renewable generation also displaces thermal energy during peak renewable resource hours, resulting in a decline in the CI of the grid.
In 2025, grid CI reductions of 0.2 and 0.5% are observed across the ERCOT and WECC regions respectively.
However, there is a trade-off between CI and absolute emissions. The analysis shows that despite a lower CI, there is a marginal increase in absolute emissions in both the ERCOT and WECC markets due to the added demand source and increased deployment of thermal units during low renewable resource hours.
Additionally, as power grids get greener, the benefits of incremental renewable additions to CI become smaller, and an increase in load drives an even larger pull on thermal units during low renewable resources hours. As a result of this phenomenon, the CI benefits seen in 2025 are smaller in 2030 and absolute emissions increase marginally in both markets.
Because of these findings, we explored sensitivities to test a couple of mechanisms to mitigate increases in absolute grid emissions and/or CI under an annual matching scenario. The analysis found that a slight overbuilding of renewables, or strategic curtailment of hydrogen production during peak thermal hours could be effective tools to minimize these unintended emissions impacts in the 2020s.
Furthermore, annual matching requires REC offsets to drive a net zero CI for hydrogen production. In ERCOT South, the CI, before offsets, of the green hydrogen produced is 4.3 kgCO2/kgH2 in 2025, and 3.4 kgCO2/kgH2 in 2030. In WECC Arizona, the CI, before offsets, is 7.9 kgCO2/kgH2 in 2025, and 4.7 kgCO2/kgH2 in 2030.
In both cases, these carbon intensities are lower than the estimated 10 kgCO2/kgH2 CI estimated for grey hydrogen production, which could drive significant decarbonization in the target sectors for hydrogen adoption.
However, these carbon intensities are also significantly higher than the zero CI of a 100% renewable green hydrogen operation.
It is expected that the outcomes would vary significantly on a regional basis.

Melany Vargas
Vice President, Head of Hydrogen Consulting
Melany has extensive experience solving strategic problems for clients across the global energy value chain.
Latest articles by Melany
View Melany Vargas's full profileAnother key consideration is that this analysis focused on Texas and Arizona where renewable resource potential is high. There is more investigation required in these, and other markets, to fully assess the economic and emissions trade-offs being considered here. It's expected that the outcomes would vary significantly on a regional basis and may also vary as hydrogen production scales well past the addition of a 250 MW electrolyzer in a region.
Managing the tradeoffs between carbon emissions and green hydrogen economics
Policymakers and regulators are in the tough position of navigating the trade-off between carbon emissions and green hydrogen economics within the context of rapidly changing US power markets.
This early analysis demonstrates that on an economic basis, annual matching could be the catalyst the green hydrogen industry needs to support the early adoption and growth of the nascent low-carbon hydrogen industry. When it comes to meeting climate targets, green hydrogen will need to be deployed alongside other solutions, therefore the sooner adoption occurs, the sooner benefits can be realized.
Beyond 2030, as the build-out of wind, solar and storage generation assets support lower carbon grids throughout the US, and electrolyzer costs come down, hourly matching could become a more appropriate mechanism to support 100% renewable green hydrogen production and power grid decarbonization in tandem.
Get the latest news and views from our experts
Each week, The Inside Track brings a selection of the latest insight from our global team of analysts to your inbox. Sign up via the form at the top of the page.


