Global upstream M&A picks up the pace
Corporate consolidation is the key driver
1 minute read
By Greig Aitken, Corporate Research and Scott Walker, Research Analyst
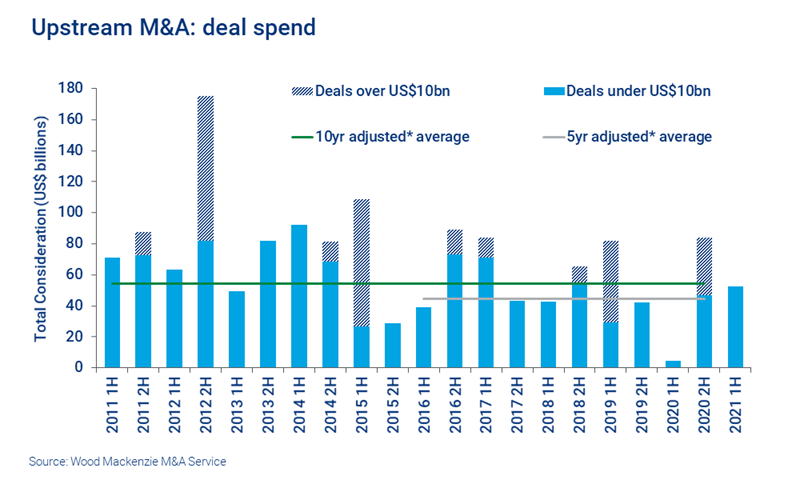
Upstream M&A picked up pace in the first half of 2021. Deal activity recovered to 2019 levels and more than doubled in comparison to the low point in the first half of 2020.
North America was the epicentre of the renewal, with 80% of global deal spend attributable to this region. Europe came in at second place. Elsewhere, deal flow increased in all regions except Africa and Latin America.
What’s driving the market? And can we expect more of the same in the second half?
This article is based on insight from our latest Global upstream M&A outlook, available to subscribers of our M&A Service or via our store. You can also fill in the form on the right for a complimentary extract.
From in-basin scale-ups to multi-basin mash-ups, companies combined at an incredible rate.
The big theme: corporate consolidation
When consolidation began to sweep the industry in 2020, oil and gas companies were in a tough spot. Low commodity prices and battered share prices were powerful forces driving companies to combine.
And while the near-term business environment has completely changed this year, consolidation has continued.
North America: the hot spot
North America has been the undoubted focus of this corporate revolution. This half’s ten largest corporate takeovers all took place in this region.
Of these, the biggest surprise was Cabot’s US$17 billion multi-basin merger with Cimarex. The deal was unusual in bringing together a gas player with a gas and oil player, just as Pioneer and others were extolling the virtues of single basin scale.
The multi-basin merger was soon followed by other diversifying transactions. From in-basin scale-ups to multi-basin mash-ups, companies combined at an incredible rate.
Visit the store to read the full insight for analysis of the headline grabbing deals in every region. Or fill in the form for a complimentary extract.
Deal spend falls back
Disclosed deal spend fell 38%: though that should be understood against the slew of big corporate transactions that took place in the second half of 2020.
And the US$52 billion – around 10% below the five-year average spend – was relatively robust.
-
115
Deals announced – back in line with 2019 levels
-
80%
Global deal spend attributable to North American-focused deals
-
US$52 billion
Total disclosed deal spend
Deal spend was weighted towards corporate transactions, which isn’t unusual. However, it is rare for this to happen without any US$10 billion-plus megadeals skewing the numbers.
There were 11 billion-dollar-plus transactions during the period (based on disclosed consideration only). All but three of these large deals were corporate takeovers, with both public and private companies in the crosshairs.
Valuations remain weak
Despite surging oil prices, deal valuations have picked up only slightly. We calculate that deals announced in H1 2021 need a long-term oil price of US$50/bbl in order to break even, versus US$47/bbl in FY20. Weak valuations will persist until more buyers emerge to create competition for assets.
More of the same for the rest of the year?
Corporate consolidation should continue to make headlines. As the energy transition progresses, we expect a lot more consolidation over the long-term.
In the short-term, for as long as investors continue to push North American companies to exercise restraint and focus on shareholder returns, corporate-level acquisitions are going to be a core route to efficient cash flow growth.
Majors focus on divestment programmes
Majors' disclosed spend on upstream transactions was the lowest on record, at less than US$30 million.
The Majors' focus is clearly elsewhere – they spent over US$8 billion on renewable and new energy deals during the period. But in upstream, transactions only went one way: disposals totalled US$7 billion across 14 deals.
The full report provides a breakdown of M&A activity by region and asset type with analysis of which deals have made the biggest waves. It’s available to subscribers to our M&A Service or via our store.
You can also fill in the form at the top of the page for a complimentary extract, which includes:
- Highlights from the Majors’ transactions
- The companies behind the deals, in charts
- Large/Mid Caps and other public E&P highlights.

