
Make your next move with our natural resources maps
Pinpoint opportunities on a map
Make strategic decisions with confidence
What might you spot if you could step away from your screen and see your industry from a different perspective? Wood Mackenzie's in-depth industry and market-data wallmaps provide a striking visual representation of your next strategic opportunity. That's why you'll find our wallmaps in corner offices and boardrooms throughout the global energy industry – even in this age of Big Data, digital maps and paperless offices.
Why buy our wallmaps
Our maps bring together trusted data and research from across the globe. And we have a team of analysts and researchers committed to ensuring the continued accuracy and consistency of data across the entire collection. With a Wood Mackenzie map, you can:
- Gain an instant visual appreciation of multiple assets and markets across global locations.
- Use them as reference documents in group discussions
- Get a single, reliable overview
-
>1000
Data points in every map
-
>30
Maps spanning multiple industries and regions
-
A0
Large printed map perfect for any office wall
What will you receive?
- Printed to make a big and lasting impression, each map is 84cm x 120cm or 33 inches x 46 3/4 inches on 180gsm paper
- Couriered to you within 5 working days when purchased online
- Delivered in a tough cardboard tube to ensure maps reach you in pristine condition
Oil & Gas wallmaps (scroll down for Metals & Mining)
Angola and Congo Oil and Gas Wallmap
Summary
This report is currently unavailable
Enquire about subscriptionsAlready have a subscription? Sign In
Australasia Energy Wall Map
Summary
This report is currently unavailable
Enquire about subscriptionsAlready have a subscription? Sign In
Canadian Oil Sands Wall Map
Summary
Our detailed wallmap of Canada's oil sands. The map provides locations of existing and planned projects, upgrading and refining infrastructure, licensed blocks and key pipelines. An insert map of North America shows existing and planned pipeline export routes from the oil sands region. The map also includes the following charts relevant to the oil sands: Oil sands remaining resource by company Oil sands land ownership by company Yearly oil sands capital spend by company Canadian heavy crude exports by destination Canadian heavy crude takeaway capacity This map is invaluable to anyone interested in Canada's oil sands. Wallmaps bought online will be couriered to you within 5 days.
This report is currently unavailable
Enquire about subscriptionsAlready have a subscription? Sign In
Caspian & Central Asia Oil and Gas Wallmap
Summary
This report is currently unavailable
Enquire about subscriptionsAlready have a subscription? Sign In
China Gas Wall Map
Summary
Our highly details wallmap showing the latest gas developments in China. The map includes detailed inset maps for the key producing areas which import piped gas into the Chinese market: Turkmenistan, east Siberia; west Siberia and for the key areas of gas demand in China: Beijing; Shanghai; Guangdong. Current and future gas pipelines, LNG import terminals and key gas-fired electricity generating stations are shown. In addition, charts show forecasts of future Chinese gas supply and demand. The map provides a rapid appreciation of: The scale and nature of the gas industry in China The key sources of gas The key gas import facilities LNG terminals and pipelines This map is an invaluable reference for anyone interested in the Chinese gas sector. Wallmaps bought online will be couriered to you within 5 days.
This report is currently unavailable
Enquire about subscriptionsAlready have a subscription? Sign In
Egypt and the Eastern Mediterranean wallmap
Summary
This report is currently unavailable
Enquire about subscriptionsAlready have a subscription? Sign In
Global LNG Wallmap
Summary
Our highly detailed Global LNG wallmap, showing LNG shipping routes, and liquefaction and regasification terminals and their project status.
Inserts show detailed views of:
- Main fields and terminals in Australia, the Middle East and East Africa
- LNG regasification terminals for Europe and North East Asia
- LNG liquefaction terminals and gas plays in North America, Gulf Coast and Western Canada
In addition, informative charts provide the following information:
- USA Lower 48 LNG exports (post-FID projects)
- LNG Demand of top importers
- LNG ship orders and deliveries v. spot charter rate
- Yamal LNG exports by final destination
This map is an invaluable reference for anyone interested in the LNG industry. Wallmaps bought online will be couriered to you within 5 days.
This report is currently unavailable
Enquire about subscriptionsAlready have a subscription? Sign In
Global Refinery Wallmap
Summary
This report is currently unavailable
Enquire about subscriptionsAlready have a subscription? Sign In
Gulf of Mexico Oil and Gas Wallmap
Summary
This report is currently unavailable
Enquire about subscriptionsAlready have a subscription? Sign In
Mexico Oil and Gas Wallmap
Summary
This report is currently unavailable
Enquire about subscriptionsAlready have a subscription? Sign In
Middle East Oil and Gas Wallmap
Summary
This report is currently unavailable
Enquire about subscriptionsAlready have a subscription? Sign In
Central Africa and Nigeria Oil and Gas Wall Map
Summary
Our detailed wall map showing the latest Central Africa and Nigeria oil and gas information, highlighting areas such as Côte D’Ivoire, Ghana and the West Africa Transform Margin.
The map shows the oil and gas fields, oil and gas pipelines, licences, operators and sedimentary basins.
Two detailed inset maps are included covering Nigeria and offshore Ghana/Côte D’Ivoire.
The map gives you a rapid appreciation of:
- The scale and nature of the Central Africa and Nigeria oil and gas business
- Which operators are active in the region
- The location of the main oil and gas fields
- The level of infrastructure
This map is an invaluable reference for anyone interested in energy in Nigeria, Central Africa and the West Africa Transform Margin areas.
Wallmaps bought online will be couriered to you within 5 days.
This report is currently unavailable
Enquire about subscriptionsAlready have a subscription? Sign In
Nigeria Oil and Gas wallmap
Summary
This report is currently unavailable
Enquire about subscriptionsAlready have a subscription? Sign In
North Africa Oil & Gas Wall Map
Summary
Our detailed wallmap of North Africa showing the latest oil and gas information for Algeria, Libya, Egypt, Morocco and Tunisia. Inset maps are shown for the key producing areas of: Tunisia, eastern Algeria, the Mediterranean, Gulf of Suez and Western Desert areas of Egypt; and the Sirte Basin in Libya. The map shows oil and gas fields, licences, operators, refineries and LNG terminals and the locations of existing and planned oil and gas pipelines. The map allows clients to gain a rapid appreciation of: The scale and nature of the oil and gas business in North Africa Which operators are active in the country The location of the main oil and gas projects The level of infrastructure This map is an invaluable reference for anyone interested in the African energy sector. Wallmaps will be couriered to you within 5 days.
This report is currently unavailable
Enquire about subscriptionsAlready have a subscription? Sign In
North Sea Oil and Gas
Summary
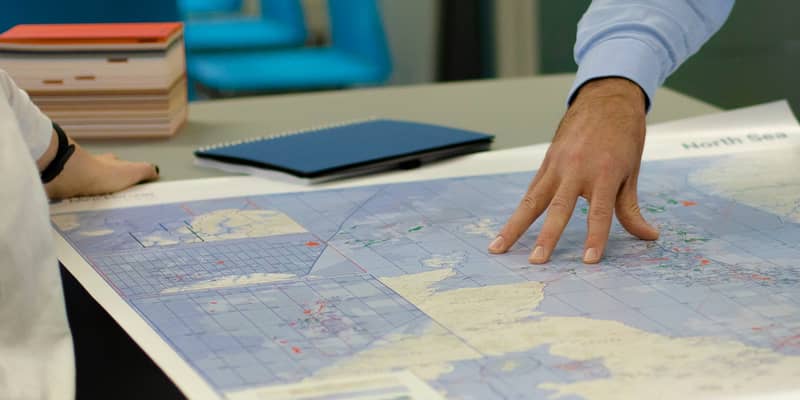
Wood Mackenzie has produced a detailed wallmap of the North Sea showing the latest information about the oil and gas infrastructure in the region.
The map shows active licences and fields and pipelines in Denmark, the Netherlands, Norway, and the UK.
The map allows clients to get a rapid appreciation of:
- The scale and nature of the oil and gas business in the North Sea area
- The location of the main oil and gas projects
- The level of infrastructure
- Norwegian Sea
- Norwegian Barents Sea
Insert maps show additional information on:
This map is an invaluable reference for anyone interested in the North West Europe energy sector.
Wallmaps bought online will be couriered to you within 5 days.
This report is currently unavailable
Enquire about subscriptionsAlready have a subscription? Sign In
Oman Oil and Gas Wall Map
Summary
Our detailed wallmap showing the latest oil and gas information in Oman. The map shows the oil and gas fields, oil and gas pipelines and infrastructure, licences and operators. The map gives a rapid appreciation of: the scale and nature of the oil and gas business in Oman which operators are active in the region the location of the main oil and gas fields the level of infrastructure This map is an invaluable reference for anyone interested in the Oman energy sector. Wallmaps bought online will be couriered to you within 5 days.
This report is currently unavailable
Enquire about subscriptionsAlready have a subscription? Sign In
Russia Upstream Oil & Gas Wall Map
Summary
Our detailed wallmap of Russia showing the latest information about the upstream oil and gas in the region. The map shows oil and gas fields, active and on offer blocks, pipelines, terminals, refineries, gas processing plants and LNG plants. Insert maps show more detailed views of: Caspian Sea East Siberia (Chayandinskoye and Kovyktinskoye fields) Yamal LNG Area Sakhalin Island Russian Basins The map provides you with a clear view of: The scale and nature of the upstream and LNG business in the region Which operators are active The location of the main oil and gas projects The extent of infrastructure, with key routes highlighted and labelled This map is an invaluable reference for anyone interested in the Russian energy sector. Wallmaps bought online will be couriered to you within 5 days.
This report is currently unavailable
Enquire about subscriptionsAlready have a subscription? Sign In
South Africa & Mozambique Wall Map
Summary
Our detailed wallmap showing the latest oil and gas information in South Africa and Mozambique. The map shows the oil and gas fields, oil and gas pipelines and infrastructure, licences and operators. The map gives a rapid appreciation of: the scale and nature of the oil and gas business in South Africa and Mozambique which operators are active in the region the location of the main oil and gas fields the level of infrastructure This map is an invaluable reference for anyone interested in the South African energy sector. Wallmaps bought online will be couriered to you within 5 days.
This report is currently unavailable
Enquire about subscriptionsAlready have a subscription? Sign In
South America Oil and Gas Wallmap
Summary
This report is currently unavailable
Enquire about subscriptionsAlready have a subscription? Sign In
South East Asia Energy Value Chain Wallmap
Summary
This report is currently unavailable
Enquire about subscriptionsAlready have a subscription? Sign In
Southern & Eastern Africa Oil & Gas Wall Map
Summary
Our detailed wallmap showing the latest oil and gas information for southern and eastern Africa. The map shows the oil and gas fields, oil and gas pipelines, licences, operators and refineries. Four inset maps show in detail: The significant gas province offshore Mozambique and Tanzania The gas fields and infrastructure of southern Mozambique The oil-rich areas of Uganda and Kenya The latest well locations and results The map gives you a rapid appreciation of: The scale and nature of the oil and gas business in southern and east Africa Which operators are active in the region The location of the main oil and gas fields The level of infrastructure This map is an invaluable reference for anyone interested in energy in southern and east Africa. Wallmaps bought online will be couriered to you within 5 days. View Source
This report is currently unavailable
Enquire about subscriptionsAlready have a subscription? Sign In
UK Oil and Gas Wall Map
Summary
Our detailed wall map of the UK oil and gas industry shows the latest information about the infrastructure in the region. The map allows clients to get a rapid appreciation of: The scale and nature of the oil and gas business in the United Kingdom area The location of active licences and the main oil and gas projects The level of infrastructure Insert maps show additional information on: Well Resource in the Northern North Sea Basin Upper Cretaceous to Danian Carbonate Play Prospective Resource Distribution Surface interpolation and stratigraphic profile – Leman field wells This map is an invaluable reference for anyone interested in the UK oil and gas sector. Wallmaps bought online will be couriered to you within 5 days.
This report is currently unavailable
Enquire about subscriptionsAlready have a subscription? Sign In
US Lower 48 Upstream Research Coverage Wallmap
Summary
This report is currently unavailable
Enquire about subscriptionsAlready have a subscription? Sign In
Vaca Muerta wallmap
Summary
This report is currently unavailable
Enquire about subscriptionsAlready have a subscription? Sign In
West Africa Oil & Gas Wall Map
Summary
Our detailed wallmap showing the latest oil and gas information for West Africa. The map shows active, relinquished and open blocks, oil and gas fields, wells, planned and existing pipelines, LNG plants, refineries, terminals, gas processing plants and operators. Insert maps give more detailed views of: Cote d`Ivoire and Ghana Equatorial Guinea and Cameroon Nigeria Gabon Angola and Congo This map gives you a rapid appreciation of: The scale and nature of the oil and gas business Which operators are active in each country The location of the main oil and gas projects The level of infrastructure This map is an invaluable reference for anyone interested in the West African energy sector. Wallmaps bought online will be couriered to you within 5 days.
This report is currently unavailable
Enquire about subscriptionsAlready have a subscription? Sign In
Our full range of Metals & Mining wallmaps
Bauxite, Alumina Refineries and Aluminium Smelter Wallmap
Summary
This report is currently unavailable
Enquire about subscriptionsAlready have a subscription? Sign In
Coal & Upstream in the Bowen & Surat Basin Wall Map
Summary
Our detailed wallmap covering both the coal and oil and gas industries in the Bowen and Surat basins of Queensland, Australia. Coal - showing operating and project mines, concessions by operator, lease type, rail and ports. Oil and gas - showing developed and undeveloped oil and gas fields, blocks by operator, pipelines (including under construction and planned gas pipelines) and LNG and gas processing plants. The map provides a rapid appreciation of: The scale and nature of the coal, oil and gas industries in Queensland Which companies operate in the region The location of the main coal mines and projects The location of the main oil and gas fields The level of current and proposed infrastructure This map is an invaluable reference for anyone interested in the Australian coal or oil and gas industries. Wallmaps bought online will be couriered to you within 5 days.
This report is currently unavailable
Enquire about subscriptionsAlready have a subscription? Sign In
Gold Mines Wallmap
Summary
This report is currently unavailable
Enquire about subscriptionsAlready have a subscription? Sign In
Illinois Basin Coal Wall Map
Summary
Our unique Illinois Basin General Coal Control wallmap, showing accurate coal control and ownership and the major mine projects identified over the last 30 years. The map also shows mine locations, railroads, navigable rivers, coal docks, power plants, and counties. In addition, informative charts provide the following information: Marketable production by project status (2009 - 2029) Marketable production by State (2009 - 2029) Production by the major producers Total cash cost components (weighted AVG) This wallmap is an invaluable reference for anyone wanting to understand the Illinois Basin coal industry. Wallmaps bought online will be couriered to you within 5 days.
This report is currently unavailable
Enquire about subscriptionsAlready have a subscription? Sign In
Lead Mines, Smelters and Refineries Wallmap
Summary
This report is currently unavailable
Enquire about subscriptionsAlready have a subscription? Sign In
Metals and Mining Asset Coverage Wallmap
Summary
$550
You can pay by card or invoice
View more details Enquire about subscriptionsAlready have a subscription? Sign In
Nickel Mines, Smelters and Refineries
Summary
This report is currently unavailable
Enquire about subscriptionsAlready have a subscription? Sign In
NSW & QLD Coal Mines and Projects Wallmap
Summary
This report is currently unavailable
Enquire about subscriptionsAlready have a subscription? Sign In
Steel, Iron Ore & Metallurgical Coal Wall Map
Summary
Our detailed Steel, Iron Ore and Metallurgical Coal Wallmap, showing the export flows of iron ore and metallurgical coal. This map enables you to gain a rapid appreciation of: The location of the world’s steel plants and iron ore mines
- The top 20 iron ore mines ranked by production
- The top 20 metallurgical coal mines ranked by production
- Each country’s steel production
- Every iron ore mine and steel plant is named ,and trade flows shown by export volume.
- The map also includes the following charts: Steel Production by Country (2013, Mt) Metallurgical Coal Exports by Country and Imports by Region (2013, Mt) ron Ore Exports by Country and Imports by Region (2013, Mt) This map is an invaluable reference for anyone interested in global steel, iron ore and metallurgical coal. Wallmaps bought online will be couriered to you within 5 days.
This report is currently unavailable
Enquire about subscriptionsAlready have a subscription? Sign In
Western US Coal Activity & Control Wall Map
Summary
Our detailed Western US Coal Activity & Control Wallmap, showing the general geology of the coalfields and the names of all the fields. The map shows all existing and proposed mine locations, mine owners, reserve blocks, railroads, existing power plants, Indian reservations, national parks, counties.
Inserts cover the following coalfields:
Bull Mountain
Absaloka
Rosebud
Foidel Creek
Bowie #2
Sufco
Skyline
Dugout
This map is an invaluable reference to anyone interested in the Western US coal industry. Wallmaps bought online will be couriered to you within 5 days.
This report is currently unavailable
Enquire about subscriptionsAlready have a subscription? Sign In
World Coal Trade Wall Map
Summary
Our detailed World Coal Trade Wallmap showing the latest information about international thermal and metallurgical coal exports. The map shows coal trade flows, global exports of thermal, metallurgical, and total coal, the destination of exports from each country and the trade figures on a total, regional, and country basis for 2015 The map gives you a rapid appreciation of: The scale and nature of international coal trade The major coal exporting and importing countries The destination and amount of coal exports on regional and individual country basis In addition, informative charts highlight exports by country and imports by region for metallurgical, thermal and total coal. This map is an invaluable reference for anyone interested in world coal trade. Wallmaps bought online will be couriered to you within 5 days.
This report is currently unavailable
Enquire about subscriptionsAlready have a subscription? Sign In
Zinc Mines and Smelters Wallmap
Summary
This report is currently unavailable
Enquire about subscriptionsAlready have a subscription? Sign In