


Transformation in the US distributed energy resource market
Opportunities, risks and the changing growth profile of distributed energy resources in the US
4 minute read

Ben Hertz-Shargel
Global Head of Grid Transformation & Large Loads

Ben Hertz-Shargel
Global Head of Grid Transformation & Large Loads
Ben leads research across electrification, data centres, grid modernisation, distributed energy resources and VPPs.
Latest articles by Ben
-
Opinion
Horizons Live: Breaking the speed limit | Webinar replay
-
Opinion
Reality bytes: the US data centre pipeline additions halved in Q4 2025 compared to the previous quarter
-
Opinion
‘Access to power’ has become ‘access to energy’
-
The Edge
How data centre growth is driving up US power prices
-
Opinion
Virtual power plant growth is getting very real
-
Opinion
US utility large-load pipelines: a reality check
The distributed energy resource (DER) market is undergoing a transformation. The last five years shone for distributed solar, which grew 130% in capital investment. But the next five years will be a story of battery storage and electric vehicle (EV) charging infrastructure, whose growth will torpedo past that of solar. This is driven by factors that seem at odds: grid insecurity and the urgency to migrate the transportation sector onto the grid.
We recently published our US Distributed Energy Resource Outlook, an annual publication from our Grid Edge Service. It contains thorough analysis of installed capacity, market size, opportunities and risks, as well as sector-by-sector insights on the rapidly changing DER landscape. Fill out the form to download an extract, or read on for answers to a few key questions.
What’s the size of the opportunity?
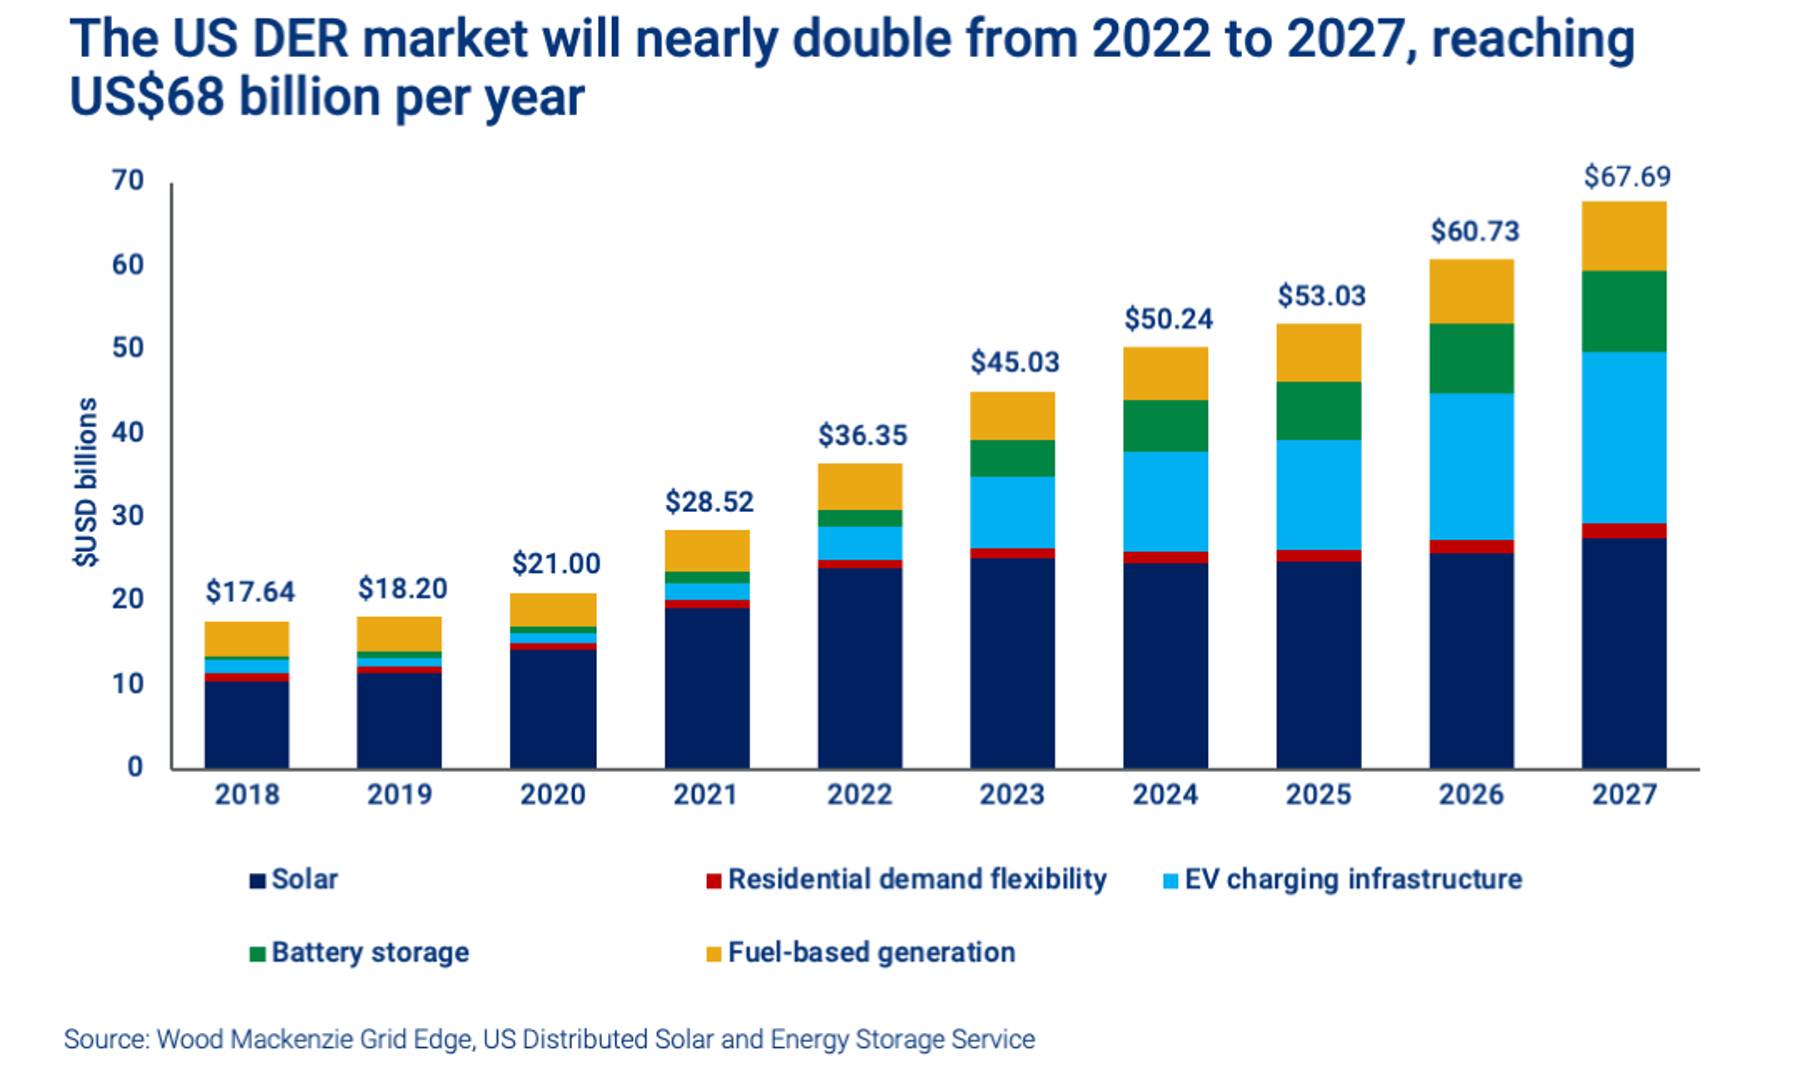
Our analysis indicates the US DER market will nearly double between 2022 and 2027, to reach almost US$68 billion per year. Behind-the-meter capacity will grow 3.7 times more over this period than it did in the previous five years. EV charging infrastructure is responsible for the lion’s share of that growth, but distributed storage will see seven times the growth in the next five years that it did in the last five.
The DER transformation underway is as much about scale as it is about market share. The 262 gigawatts (GW) of new DER and demand flexibility capacity set to be installed from 2023 to 2027 will nearly match the 272 GW of utility-scale resources due to be put in place over the same period. (Demand flexibility refers to the typical amount of load a demand-based resource can shed when called upon under typical conditions, so represents capability and not necessarily capacity actively being bid into utility or market demand response programs).
This is a gigawatt-scale reminder that the investment and financing opportunities behind the meter are just as large as those in front of the meter. And significantly, these investments are not dependent on a rapid transmission build-out.

What’s driving DER growth in the US?
Grid insecurity affecting homeowners and businesses alike represents the strongest demand pull. As a result, the market for distributed fuel-based generation will grow 240% between 2022 and 2027, while the distributed storage market will soar 460%, reaching nearly US$10 billion per year.
The continued failure of independent system operators (ISOs) and regional transmission organisations (RTOs) to reduce the time and cost of interconnection would be a further boost to demand. This is because utilities and corporates will be forced to look to distributed resources, including demand flexibility, to achieve reliability and clean energy goals.
Huge federal incentives and plentiful financing capacity will be strong catalysts for growth. Most significant are the tax credits put in place as part of the Inflation Reduction Act (IRA) and grants from the National Electric Vehicle Infrastructure (NEVI) programme. State storage incentives and utility make-ready programmes for EV charging station development will also be contributing factors.
Which sectors will be the key drivers of DER demand?
Capital investment growth will be highest for distributed solar, due to high costs per kilowatt of capacity. However, EV charging infrastructure will see the strongest capacity growth, with annual installed capacity overtaking distributed solar for the first time in 2023. By 2027, annual EV infrastructure additions will hit 70 GW, representing an investment of US$20 billion.
Most of this capacity will be residential, so utilities have a short time window to establish EV rates and managed charging programmes. However, while it has yet to kick into gear, infrastructure for buses and commercial trucks represents a growing share of the market, reaching 8.5 GW of annual installed capacity in 2026. The NEVI programme will drive installations along highway corridors, while brick-and-mortar retailers, led by Walmart, will account for a further 13 GW of public capacity. The Advanced Clean Trucks rule will be game-changing for the deployment of electric medium- and heavy-duty trucks and fleet charging infrastructure.
What are the risks to US DER growth?
While the overall outlook is highly positive for distributed energy resources, there are potential headwinds that could limit the scale of growth. Increased labour costs and a lack of qualified installers for EV chargers and heat pumps are an issue, while critical mineral and component pricing volatility could have a negative impact on multiple technologies.
If domestic manufacturers fail to rapidly stand up production capacity for solar, battery, and EV charging components, domestic content requirements could prevent DER providers from capturing valuable tax credits in the IRA.
Persistently high interest rates could reduce customer investment in DERs. Meanwhile, low capacity prices in wholesale markets could weigh on customer enrolment and retention for demand response programmes, in which customers are paid in advance for their commitment to curtail during grid emergencies.
More significant than the wholesale market access issues resolved by the Federal Energy Regulatory Commission’s Order No. 2222 are the issues that the order will not resolve, particularly for small customers. These issues involve meter data access for settlement, baseline methodologies, and the restriction of aggregations to single transmission nodes. The transition away from net metering tariffs will similarly act as a double-edged sword, suppressing the distributed solar market on one hand but incentivizing storage on the other.
Get further insight into US distributed energy resources
Our report extract contains a selection of key slides from the report. These include a market scorecard, charts illustrating expected capacity growth and an analysis of key demand drivers for the US DER market.