


Class of 2022: benchmarking this year's upstream FIDs
We benchmark the major oil and gas projects seeking FID in 2022 on economics and emissions metrics
1 minute read
There could be as many major upstream FIDs in 2022 as the two prior years combined. So, what does the class of 2022 tell us about operators' ability to stick with lessons learned? While continuing to focus on managing costs, some will want to move quickly and carefully to add supply while avoiding the impacts of cost inflation.
We explored this topic in depth in a recent report to answer questions such as:
- How does the class of 2022 benchmark on economic and emissions metrics?
- Which resource themes will drive new investment?
- How resilient are they to prices and inflation?
Fill in the form for a complimentary extract, and read on for an introduction.
Project returns remain attractive while emissions intensity trends down
Appealing economics and favourable emissions intensities for the class of 2022
- With a 70% weighting to oil, 2022 projects require an average of just US$49/bbl to generate a 15% IRR
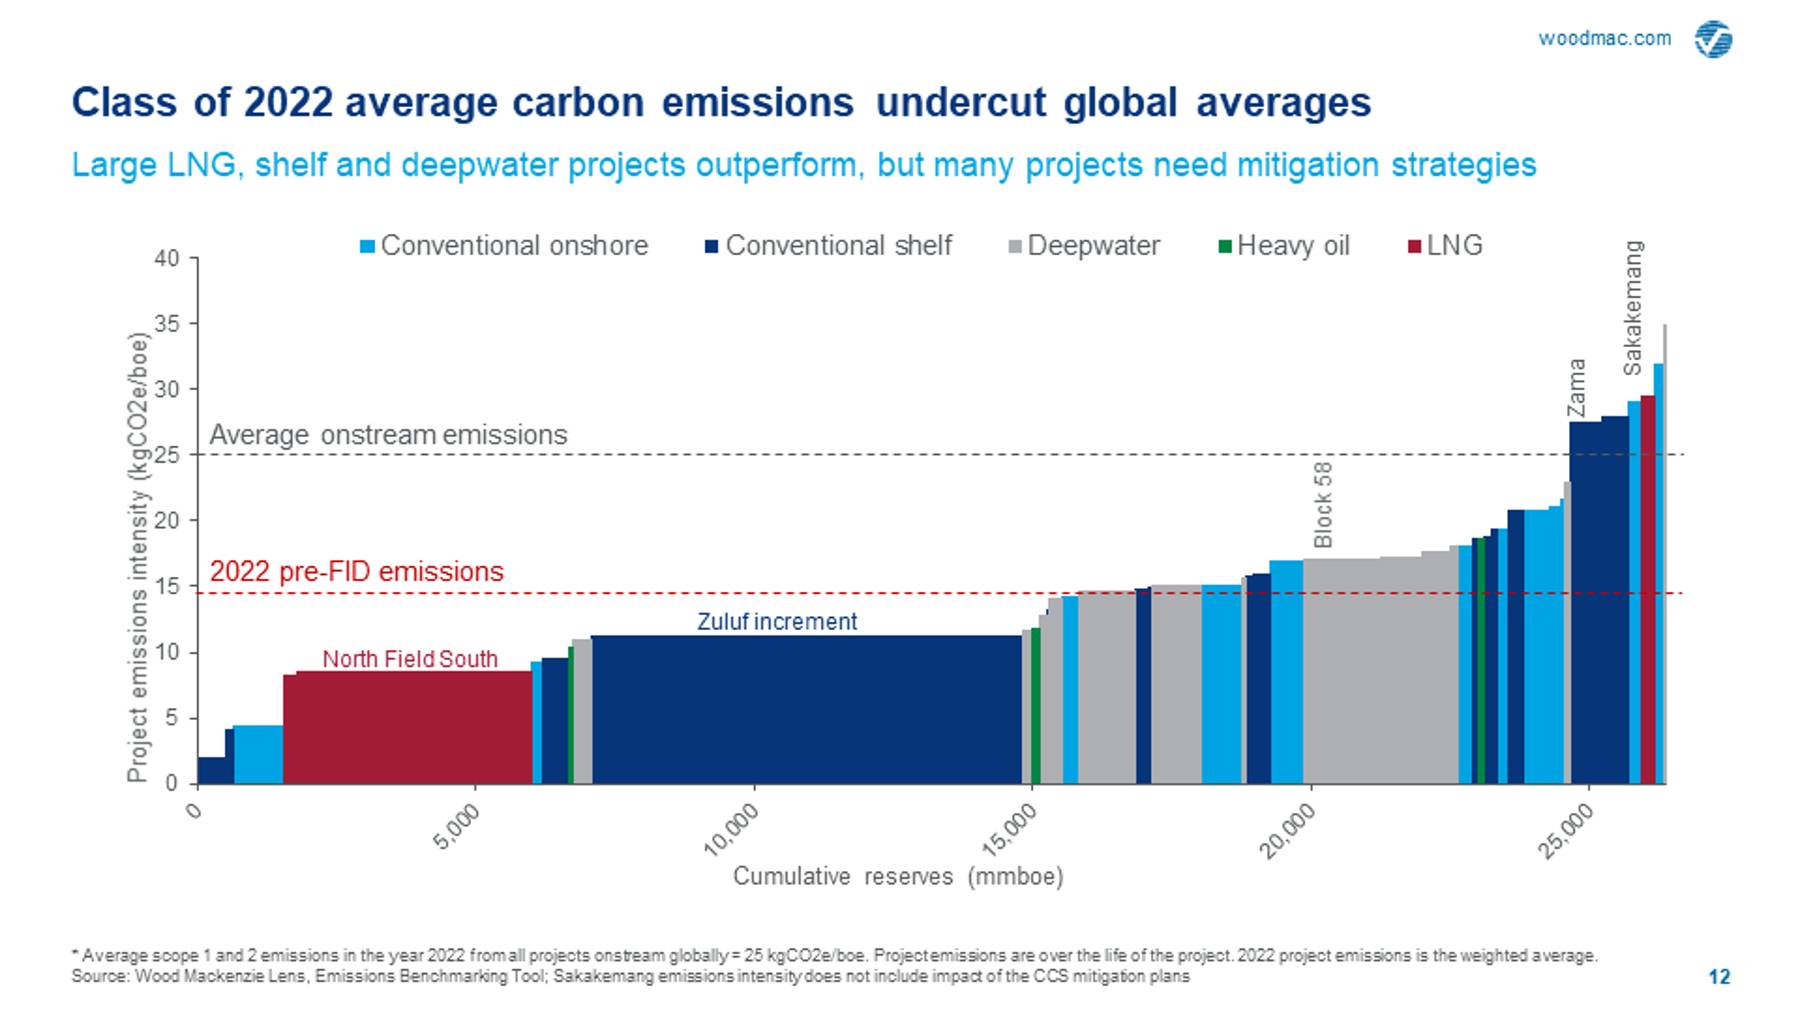
- A weighted average IRR of 20% at US$50/bbl is marginally lower than 2020 / 2021 projects, but an emissions intensity of just 15 kgCO2/boe is far below the global onstream average of 25 kgCO2/boe
- Deepwater oil delivers on both metrics, while class-leaders in LNG will integrate CCUS to add Scope 1 and 2 outperformance to an already advantaged Scope 3 position
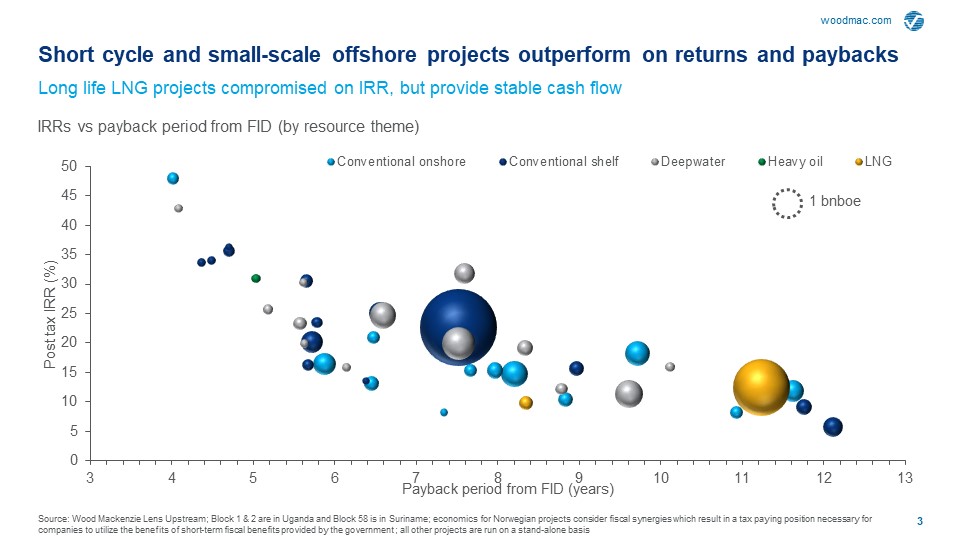
- The very best projects, in returns and payback terms, are short cycle and small-scale offshore, both deepwater and shelf
But less resilience to lower oil prices than in previous years
- The weighted average P/I ratio is 1.3 versus 1.6 for all major projects since 2021.
- Conventional projects in the Middle East are the most resilient to low oil prices, and some are also well leveraged to the upside.
The Middle East and Norwegian projects are the most shielded from cost inflation
- Breakevens for the class of 2022 increase by an average of US$2.6/bbl per 10% of Capex inflation (NPV15).

Complete the form at the top of the page to download a complimentary extract of the full insight.
Data from this report was taken from Lens Upstream which enables you to analyse, benchmark, model, and value assets and companies using the industry’s most advanced data-analytics platform.
With Lens, you'll not only reduce the time it takes to make decisions, but you will also increase the accuracy and quality of your upstream analysis to build more resilient and sustainable portfolios. Learn more about Lens.