Get in touch
-
Mark Thomtonmark.thomton@woodmac.com
+1 630 881 6885 -
Hla Myat Monhla.myatmon@woodmac.com
+65 8533 8860 -
Chris Bobachris.boba@woodmac.com
+44 7408 841129 -
Angélica Juárezangelica.juarez@woodmac.com
+5256 4171 1980
Solar tariffs hold back Q3 installations, scramble project timelines as procurement pipeline booms
2 minute read
The Section 201 solar tariffs took a toll on U.S. utility-scale solar installations in the third quarter according to the U.S. Solar Market Insight Report for Q3 from Wood Mackenzie Power & Renewables and the Solar Energy Industries Association (SEIA). The residential market, meanwhile, continued to stabilize after a down 2017. Overall, the analysts expect 2018 growth to be flat.
For the first time since 2015, quarterly additions of utility-scale solar photovoltaics (PV) fell below 1 gigawatt (GW), highlighting the impact of the tariffs and the uncertainty surrounding them in late 2017 and early 2018. As a result, the U.S. solar market was down 15 percent year-over-year in the third quarter of the year, but the report notes that a strong project pipeline lies ahead.
“Developers originally planning to bring projects online in Q3 2018 were forced to push out completion dates to Q4 2018 or Q1 2019 due to uncertainty around tariffs,” said Colin Smith, Senior Analyst at Wood Mackenzie. “We did, however, see utility PV procurement outpace installations fourfold in Q3, showing that despite the tariffs causing project delays, there is substantial growth ahead for the U.S. utility PV sector.”
Even with the tariffs, the report forecasts 3.5 GW of utility PV for Q4 2018, and projects that the fourth quarter will be the largest quarter for utility PV installations since Q4 2016, as Wood Mackenzie expects many of the delayed projects to come online by the end of the year.
FIGURE: U.S. Utility PV Pipeline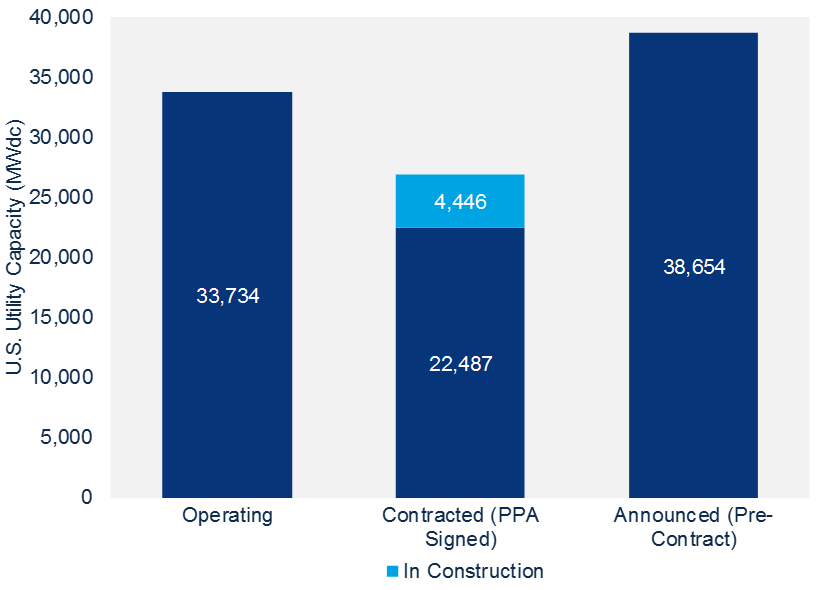
On the residential side, Q3 was the third consecutive quarter in which residential PV was essentially flat or marginally up on both a year-over-year and quarter-over-quarter basis after the market had contracted by 15 percent in 2017. Nevada was a particular bright spot as the state experienced steady installation growth, and Florida is on pace for a strong year.
Slightly improving their 2018 forecast, Wood Mackenzie now expects a total of 11.1 GW of new PV installations to come online by the end of the year.
The report said there was positive quarterly growth in the non-residential solar segment despite a year-over-year decline. California’s commercial sector experienced solid growth and New York saw a record-breaking quarter. Minnesota’s community solar build out continued, with more than 400 megawatts added so far this year.
“If not for the tariffs, the U.S. solar market would undoubtedly look better today than it does now,” said Abigail Ross Hopper, SEIA’s president and CEO. “However, as this report shows, this is a resilient industry that cannot be kept down for long. With smart policies in place, the potential for the solar industry is hard to overstate.”
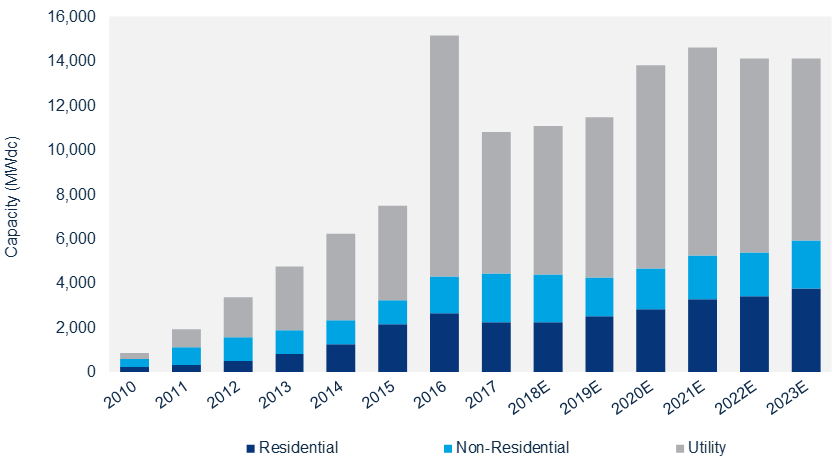
Total installed U.S. PV capacity is expected to more than double over the next five years. By 2023, more than 14 GWdc of PV capacity will be installed annually.
FIGURE: U.S. PV Installation Forecast, 2010-2023E