


Global LNG Wallmap
Summary
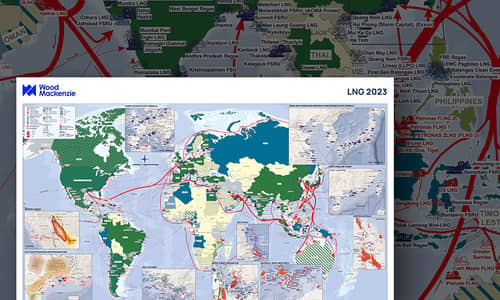
Our highly detailed Global LNG wallmap, showing LNG shipping routes, and liquefaction and regasification terminals and their project status.
Inserts show detailed views of:
- Main fields and terminals in Australia, the Middle East and East Africa
- LNG regasification terminals for Europe and North East Asia
- LNG liquefaction terminals and gas plays in North America: Gulf Coast and Western Canada
In addition, informative charts provide the following information:
- USA Lower 48 LNG exports (post-FID projects)
- LNG Demand of top importers
- LNG ship orders and deliveries v. spot charter rate
- Yamal LNG exports by final destination
This map is an invaluable reference for anyone interested in the LNG industry. Wallmaps bought online will be sent to you by courier.
Why buy a wallmap?
Our maps bring together trusted data and research from across the globe. And we have a team of analysts and researchers committed to ensuring the continued accuracy and consistency of data across the entire collection. With a Wood Mackenzie map, you can:
- Gain an instant visual appreciation of multiple assets and markets across global locations.
- Use them as reference documents in group discussions
- Get a single, reliable overview
What will you receive?
- Printed to make a big and lasting impression, each map is 84cm x 120cm or 33 inches x 46 3/4 inches on high quality paper
- Couriered to you when purchased online
- Delivered in a tough cardboard tube to ensure maps reach you in pristine condition
Other reports you may be interested in
LNG short-term webinar: July 2026
Global gas prices have rallied since mid-July after the US-Iran interim peace agreement collapsed.
$1,050Carbon policy in brief
Rolling coverage of the most important carbon market and policy movements.
$1,250China economic focus July 2026: AI and the next phase of China’s growth
AI's macroeconomic payoff will arrive in stages for China
$1,150


