Discuss your challenges with our solutions experts
Global solar adoption diversifies, European wind slows
Highlights from our solar, wind, grid edge and energy storage research
1 minute read
Renewable and emerging technologies bring equal parts opportunity and uncertainty to energy markets.
Fortunately, Wood Mackenzie Power & Renewables analysts are tracking pricing, demand, and the national and local policies that are shaping markets.
What follows is a high-level snapshot of the near-term outlook for solar, wind, energy storage and advanced metering infrastructure (AMI) markets.
Solar
The global solar PV market will add over 100 gigawatts of capacity for the first time in 2018 — and there is no looking back.
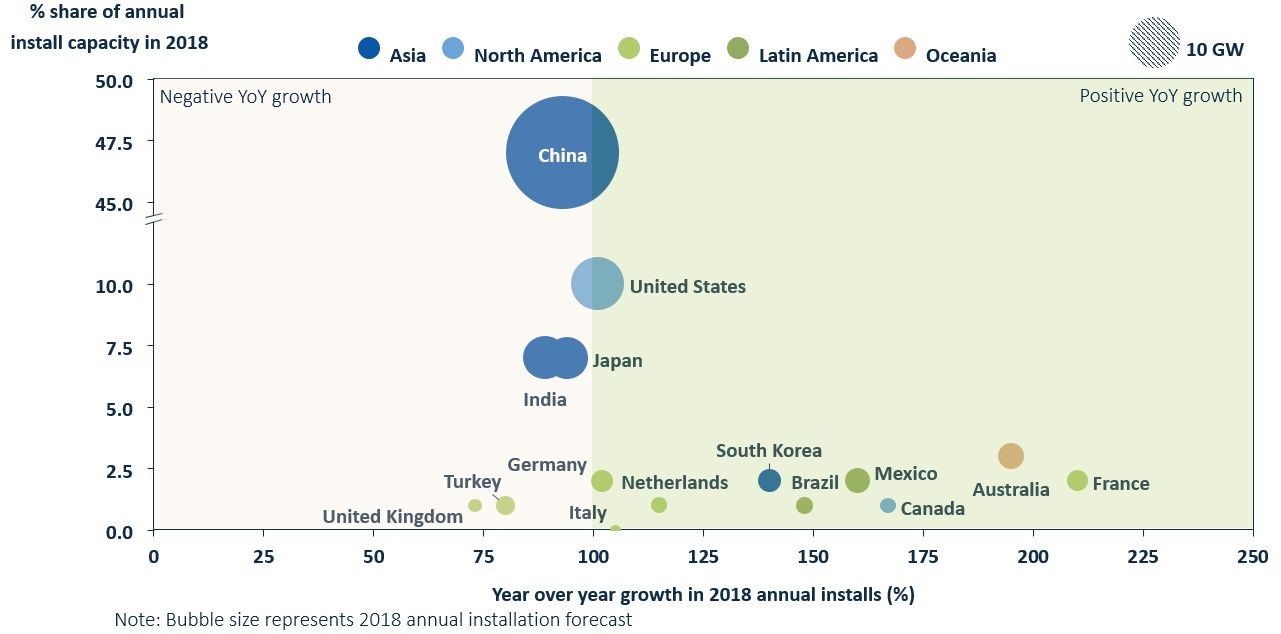
According to the latest Global Solar Demand Monitor, installations will reach 104 gigawatts this year, representing 6 percent annual growth. After that, annual installations will easily exceed the 100-gigawatt milestone through at least 2022.
The year-over-year growth is due in part to geographic diversification, as the top four markets are anticipated to collectively decline by 7 percent.
 Source: GTM Research
Egypt and Brazil will become gigawatt-scale markets for the first time in 2018. This year will also see the re-emergence Spain. Meanwhile, France, which will firmly establish itself as one of Europe’s top three largest markets.
Wind
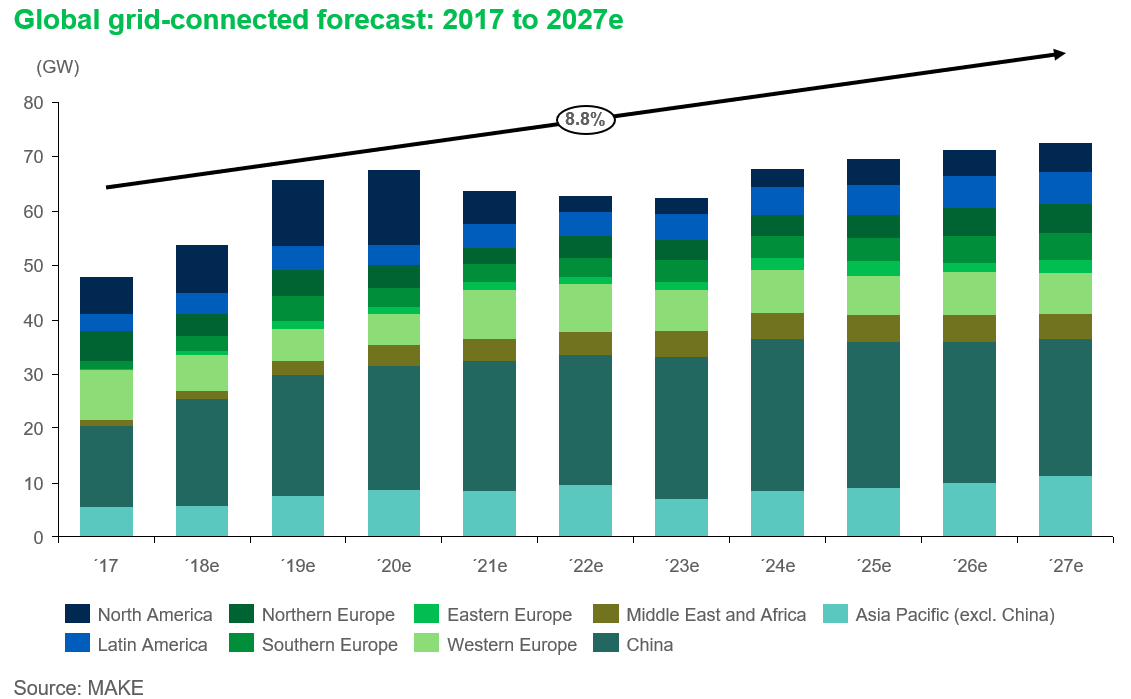
In 2015, the global wind market added 62 gigawatts of new capacity, which has since been followed by years of less impressive additions – 52 gigawatts and 47 gigawatts in 2016 and 2017 respectively. According to the latest Global Wind Market Outlook Update, 2018 will bring back year-over-year growth to the industry, which is expected to add more than 53 gigawatts of new capacity globally. And 2018 will only be the first of several years of consecutive growth as incentive expirations and markets adjusting to new auction mechanisms influence a run-up to 2020, with a more than 30 percent increase in annual capacity additions from 2017 to 2020.

The gradual build to a 2020 peak is also the case for North America in which the US wind power industry avoided complete disaster through tax reform negotiations at the end of 2017. While the new policy is in place, it has impacted project timelines and pushed some capacity into the 2019 to 2020 growth bubble. However, safe harbor wind turbine deals signed at the end of the year 2017, will support build in 2021 too.
In Europe, characterized by its more diverse markets, things look a little different. Overall, capacity additions in 2018 will drop in the region, triggered by decreases in Northern and Western Europe, but not enough to hinder an almost 7 percent CAGR in 2017-2027. In the short term, growth in the onshore sector is led by a burst of final investment decisions in Sweden for projects scheduled for 2018 to 2020, as developers try to secure green certificates. In the Southern and Eastern parts of Europe, the industry will experience gradual growth until 2021 and 2019 respectively – among several factors are the grid connection of the first Spanish auction projects in 2018.
Energy Storage
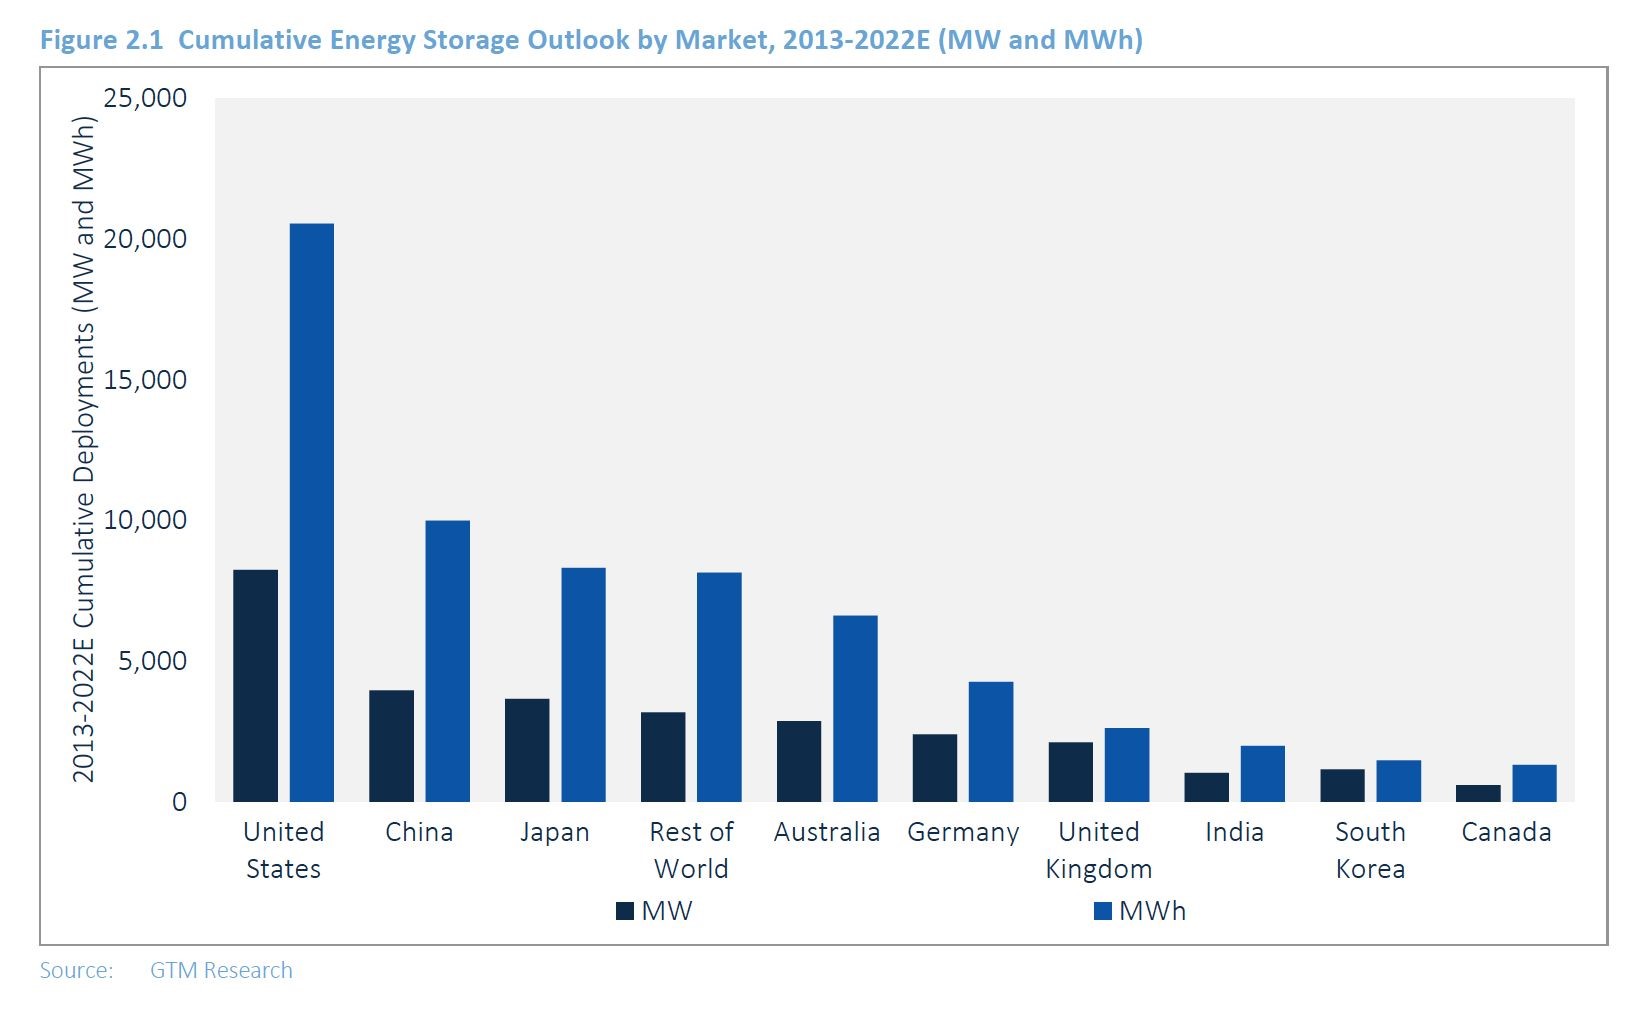
Energy storage has gone global, but in a lumpy and heterogeneous way.
The U.S. and Australia led the pack in 2017, thanks to several mega-projects coming online, and market drivers that reward storage investment. Germany and Australia thrive in the residential storage segment, which hasn't achieved significant scale in the U.S.
China is just getting started, but could surpass almost everyone in deployments over the next five years.

Most of these markets have barely emerged from their pilot stages and offer very few use cases for storage that can earn a profit. Expect that to change rapidly in the coming years.
AMI
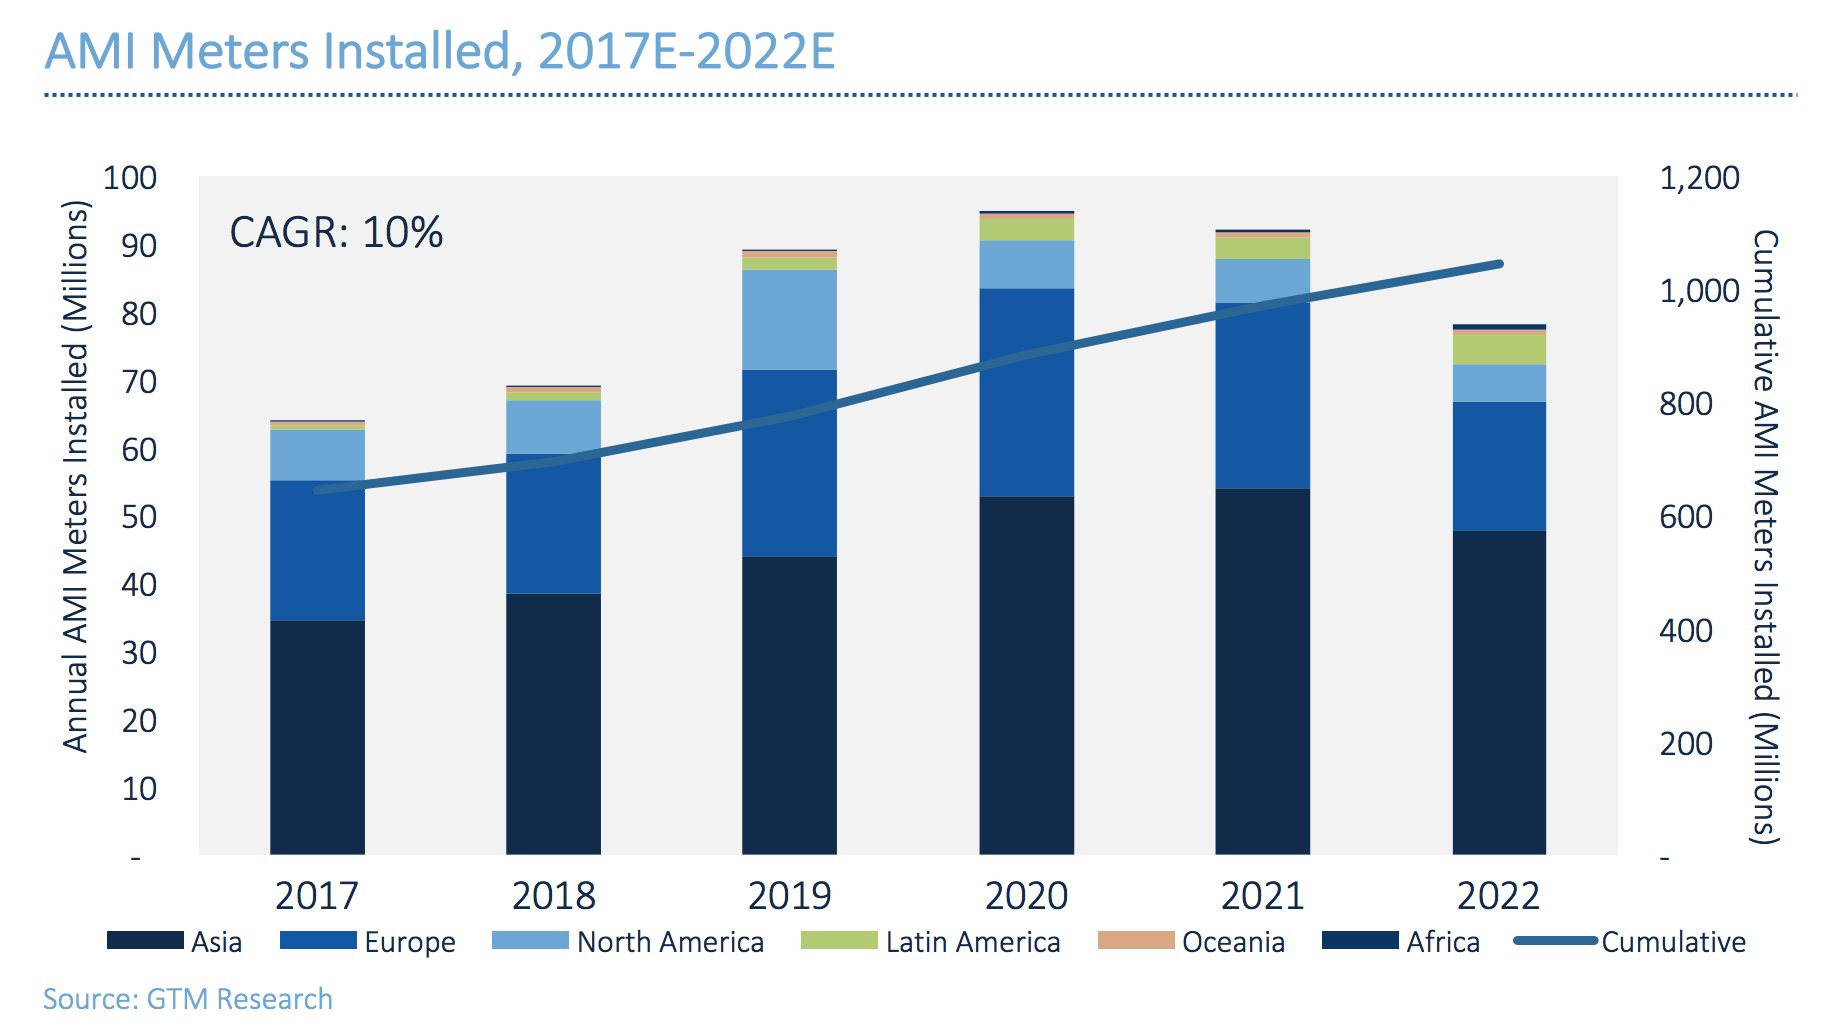
Between now and 2020, yearly installations of advanced meters will grow by 16 percent on average. By 2022, global AMI endpoints will hit the 1 billion mark, according to GTM Research forecasting.

China and Japan represent the biggest markets. Europe's share of the market increases through the end of the decade as countries work to meet region-wide targets for smart meters. After Europe's AMI deadline in 2020, the global market slows down a bit.
In the U.S., where more than half the country's households have smart meters, activity will pick back up through 2020 as roughly 10 large utilities execute new meter deployments.
GTM Research, MAKE Consulting and Wood Mackenzie are combining to form Wood Mackenzie Power & Renewables. Contact us using the form at the top of the page to learn more about gaining access to our ongoing research and data.


