1 minute read
Our team of upstream experts regularly guide customers who need to gain a clear, concise and comprehensive view of why their investment is floundering. Lately, customers expressed growing concerns surrounding an under-performing operator in the Eagle Ford. Customers want to know why it has underperformed versus its peers and why debt is growing.
We've utilized Wood Mackenzie Well Evaluator to help our investor customers with peer benchmarking. Here's a look at how we did it.
Step 1: We filtered for the criteria that best fit the operator's acreage and drilling activities in the Eagle Ford
i) Hawkville Condensate and Maverick Condensate subplays
ii) Dimmit and Webb Counties
iii) Top 5 area operators
Step 2: Next, we refined the previous filter to only include completions from the last two years
This helped us narrow down the most recent production performance, which showed the operator's assets are falling short compared with their nearest competitors.
Watch our on-demand webinar to see how you can utilize Wood Mackenzie's subsurface data, as well as completion and well design parameters to fully understand productivity improvements.
Step 3: To further assess the underperformance, we decided to take a look under the hood of producers operating in the same areas
First we evaluated their well spacing – the bulk of their wells are on 660-foot spacing, versus the underperformer's 330-foot spacing. To correct underperformance, the operator has promised to upspace wells, so there's hope that the corrective steps will improve future results.
Step 4: In the next step, we filtered down further into the operator's corrective steps – are they actually working?
While some wells are now up to 660-foot spacing, the company continues to complete older sections that were drilled on 330-foot spacing.
We drew up the results of the operator's initial production (IP) per foot vs proppant per foot, in case the previous type-curve analysis didn't fully reflect the new wells. The results weren't promising – the operator's performance is low compared with its closest competitors in the same region.
Step 5: In our final step we pondered – is geology to blame?
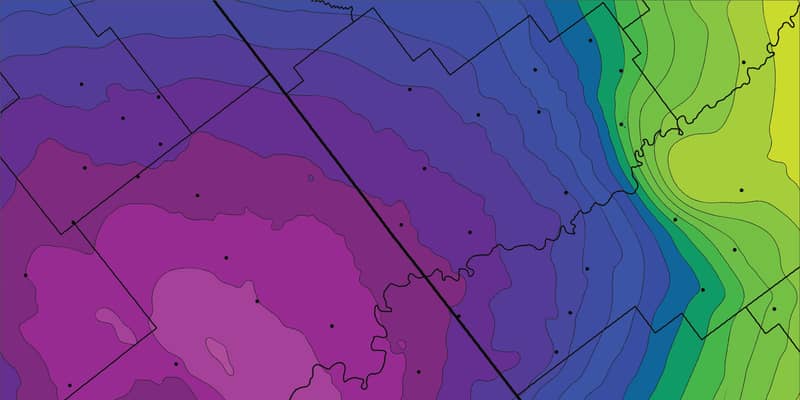
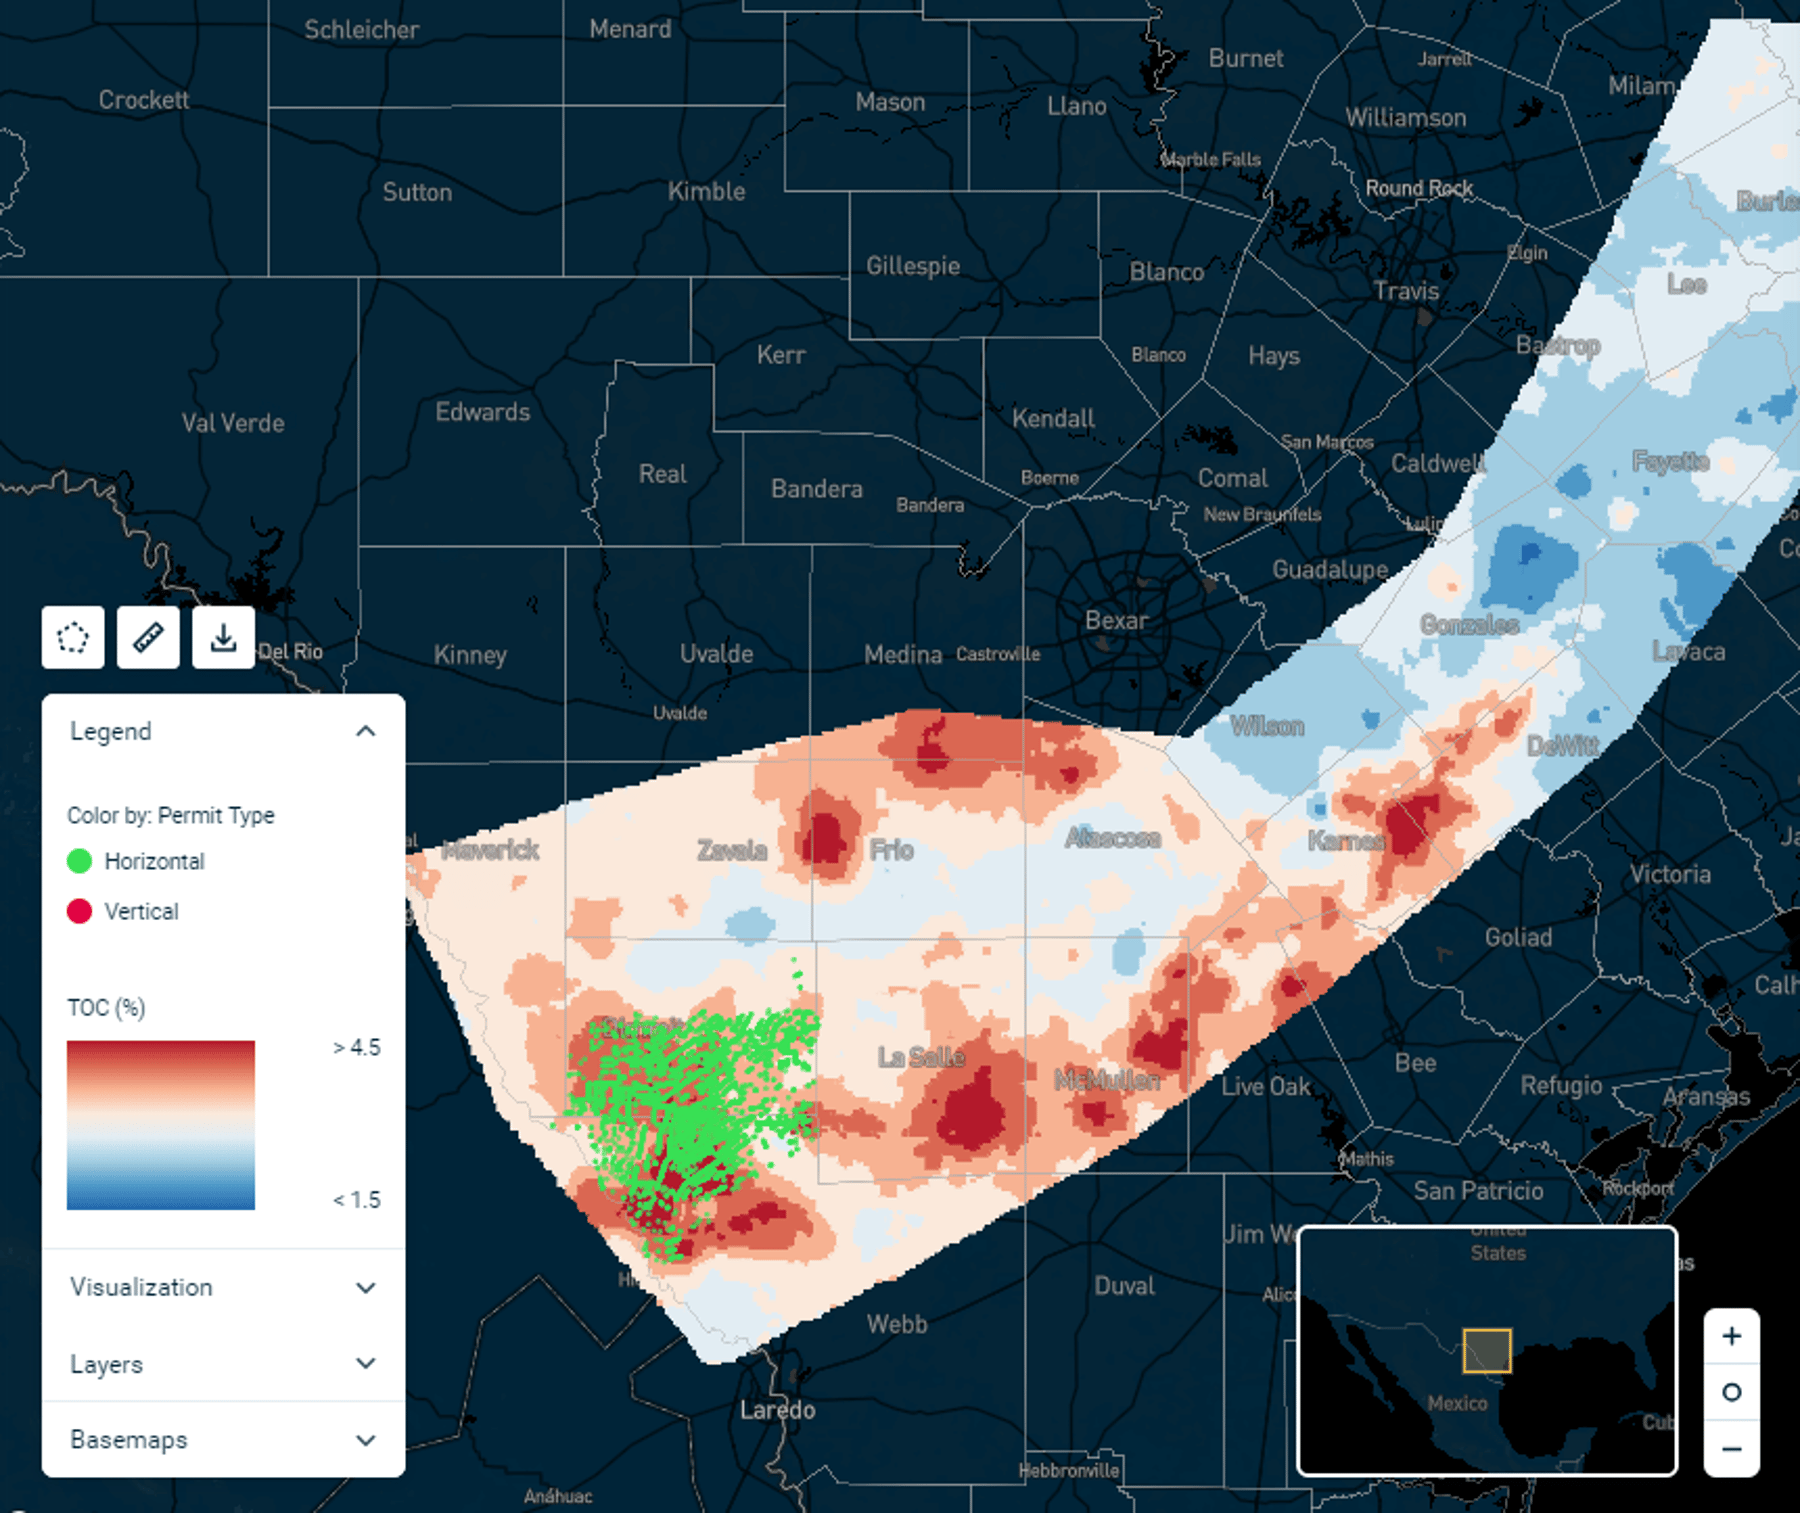
It's possible. The nearest competitor's acreage is in an area with higher total organic carbon (TOC) compared to that of the under-performing operator.

Well Evaluator's new subsurface layers helped us dive into the TOC in the underperformer's acreage.
Our conclusions? It's likely that the underperforming producer will be challenged to make significant improvements. We'll continue to watch as fresh production data emerge to see if they can turn this ship around.
Perform your own benchmarking and valuations using Well Evaluator. Click here to schedule a demo.