Why real-time data could be the key to successful power trading strategies
Assessing the impact of changing patterns in the distribution of intraday volumes
1 minute read
Błażej Radomski
Principal Analyst, Europe and Japan Power Markets

Błażej Radomski
Principal Analyst, Europe and Japan Power Markets
Latest articles by Błażej
-
Opinion
Changing price patterns in the European power markets
-
Opinion
Why real-time data could be the key to successful power trading strategies
Across Europe, volumes traded in the continuous intraday power markets are growing. One explanation for this phenomenon is the steadily increasing share of renewables in the generation mix, characterised by a volatile output profile. How does this impact trading strategies?
During a recent Enspired webinar, I drew on Wood Mackenzie’s short-term analytics capabilities to analyse changing patterns in the time distribution of intraday volumes and consider how these patterns affect trading behaviour and algorithmic traders’ settings. Fill in the form to watch a replay and get a complimentary copy of the presentation slides. And read on for an introduction.
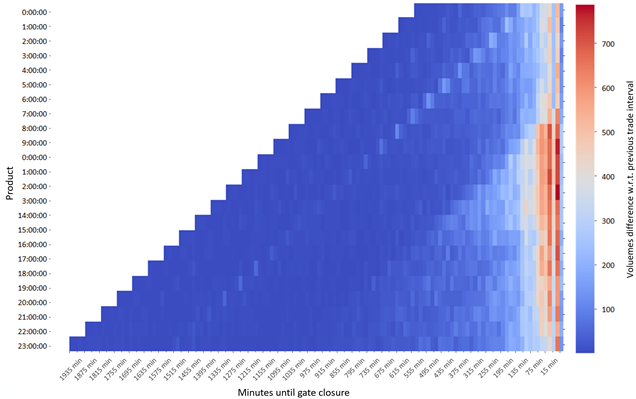
The diagram above visualises the volumes recorded in the German hourly continuous intraday market in September 2021. Besides the obvious fact that most trades are being made close to the gate closure (shown in the red and orange fields in the heat map), we can also observe increased trading activity on some fixed time points (represented by the white diagonal patterns).
These timepoints can correspond to significant events, such as the start of the European Cross-Border Intraday (XBID) phase or publications of essential forecasts.
Identifying higher liquidity timeslots supports effective trading strategies
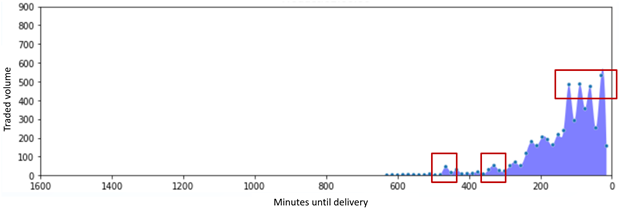
A more detailed investigation highlights the importance of increased market liquidity for building a more successful trading strategy. For example, the following chart shows extended trading activity during some specific timeslots in the course of continuous trading at the European Power Exchange (EPEX).
Traded volumes aggregated by minutes until gate closure. Hour 02-03, German continuous intraday market, January 2021
The red rectangles highlight 15 minute timeslots with higher recorded volumes. Placing the order book entries and executing trades during these periods could be an important element of an effective trading strategy. Why? The higher liquidity decreases the danger of random trades and non-fundamental prices, so scaling an algorithmic trader to be active preferably during these timeslots could potentially improve the win/loss ratio.
Real-time data is a trading gamechanger
Access to real-time data can make all the difference. The forecast is always the starting point, and it must be precise, accurate and of high quality. Furthermore, it must be frequently updated and delivered in an accessible way – over an API for example.
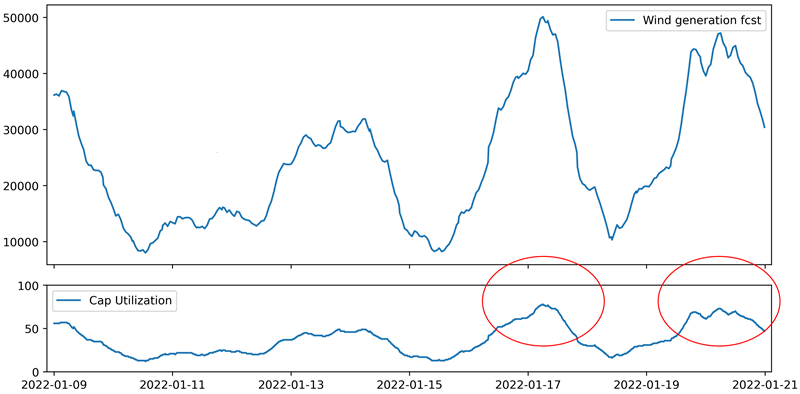
As shown below, the forecasted wind generation in Germany reached up to 50.000 MWh/h on the windiest days in January. At the same time, the predicted capacity utilisation touched 75-78%.
However, as there is no perfect model and no perfect forecast, the realisation of the forecasted production might differ. ‘Missing’ or ‘additional’ volume enters the intraday market, where trading can happen until the last moments before gate closure. Hence, estimating the forecast’s potential errors in real-time can assure competitive advantage in the continuous intraday market environment.
For example, the chart below shows an example of real-time generation recordings of two German offshore wind farms in January 2022. Apparent differences between the two monitored assets can be observed. The first wind farm is smaller and produces limited output during many hours. At the same time, the larger farm contributes with higher absolute production and a different hourly profile.
In addition, one can observe a different maximum and average capacity utilisation for each farm. While the first records a maximum of 62.2% and an average of 10.4%, the second reaches a maximum of 88.6% capacity and operates at 47.2% capacity on average.
This type of information allows us to estimate the wind forecast error on the country (price zone) level, entering the intraday market as ‘residual’ volume and affecting the price accordingly. ‘Residual’ volumes, capacity utilisation and forecast errors of different technologies, as well as information about flows and grid utilisation, can then be used in algorithmic trading strategies or as features in machine learning (ML) algorithms.
This data is available in real-time from Wood Mackenzie, thanks to a fleet of monitors measuring the electro-magnetic field on transmission lines and converting it to power flow.
Find out more about our short-term analytics services.
Interested in automated trading strategy?
Blazej Radomski explored this topic in Commodities People/Enspired’s recent webinar: Keeping the Lights on with AI: Stabilising energy markets via flexible assets and automated trading. If you missed it, fill in the form at the top of the page to watch the replay and access Błażej's presentation slides.


