Lower 48 winter gas production surge
Behind the numbers: exploring the latest winter gas production rise
2 minute read
Randall Collum
Senior Vice President, Commodity Trading Data and Analytics

Randall Collum
Senior Vice President, Commodity Trading Data and Analytics
Randall is an experienced analyst with more than 20 years of experience in natural gas and oil production analytics.
Latest articles by Randall
-
Opinion
North America natural gas summer market outlook – 2025
-
Featured
Oil, power, gas trading 2025 outlook
-
Opinion
4 critical moments for North American oil and gas trading
-
Opinion
5 factors affecting North American natural gas markets this winter
-
Opinion
What does summer 2024 hold for North American gas and LNG?
-
Opinion
Cold weather impacts on US natural gas
In recent weeks, we have witnessed close to a 3.0 billion cubic feet per day (bcfd) increase in gas production. Lower 48 production has surged since the beginning of November, with daily pipe production going from 102.2 bcfd to as high as 105.9 bcfd.
In a recent report Winter Gas Production Surge, we explore the regional production growth, dive into what we expect is real and what is inflated due to pipe estimates. The analysis also looks at the factors most likely to impact on our forecast for the rest of the winter and 2024. Fill out the form to download the report and read on for a brief overview.
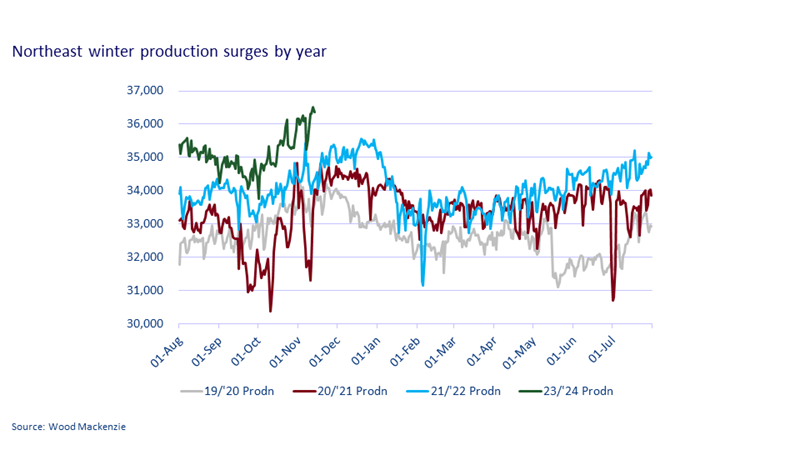
Since early November, production in the Lower 48 has spiked, escalating daily pipeline output from 102.2 bcfd to a peak of 105.9 bcfd. The biggest contributors to the surge have been Texas, adding 1.6 bcfd since the end of last month; Permian New Mexico, up 0.8 bcfd since the end of October; the northeast, which has added 1.5 bcfd since the middle of October; and the Rockies, up 0.3 bcfd since the beginning of the month.
The Northeast and the Permian basin are leading the charge, with smaller impacts being seen in the Rockies, Oklahoma, and the Haynesville Shale. For most of the year, data pointed to the fact that there was an upside risk to our production forecast for the winter, as prices were low for most of the summer and the contango in the gas price curve seemed to exacerbate the risk.
We anticipate the big jump in this region to drop off relatively quickly, with a combination of flush production and drilled but uncompleted wells (DUCs) coming online causing this. This is outlined in the graph below which shows how similar this increase in production is to the winters of ’19/20, ‘20/21, and ‘21/22.
All three times this flush production has previously occurred, production peaked within about 6 weeks and was back to where production started by the end of the winter. Based on history, we would expect this winter to end back closer to the 35.0 bcfd level.
The productive capacity for the Lower 48 is currently the highest on record, and operators are making adjustments to optimise their revenue more than ever. Wild swings in production based on prices and operator reactions could become the norm going forward.
In other regions, there is a perceived upside to the current forecast, as shown in the graphs in the full report. Fill in the form at the top of the page to download the report for more analysis on this.


