Solar: a two-headed dragon looms on the horizon
Solar PV asset owners face both rising O&M cost risk and operational underperformance – digital solutions could play a vital role
1 minute read
With demand for renewables rising rapidly, the future looks bright for solar photovoltaics (PV). But the double impact of cost escalation risk and energy production underperformance creates a potential ‘Catch-22’ situation for asset owners.
I recently co-hosted a webinar exploring this issue with Hao Shen, Director and Head of Data Products at kWh Analytics. Read on for a recap of some of the key themes from our discussion – and fill in the form to access a complimentary copy of the presentation slides.
Solar O&M contract pricing is being squeezed to the limit
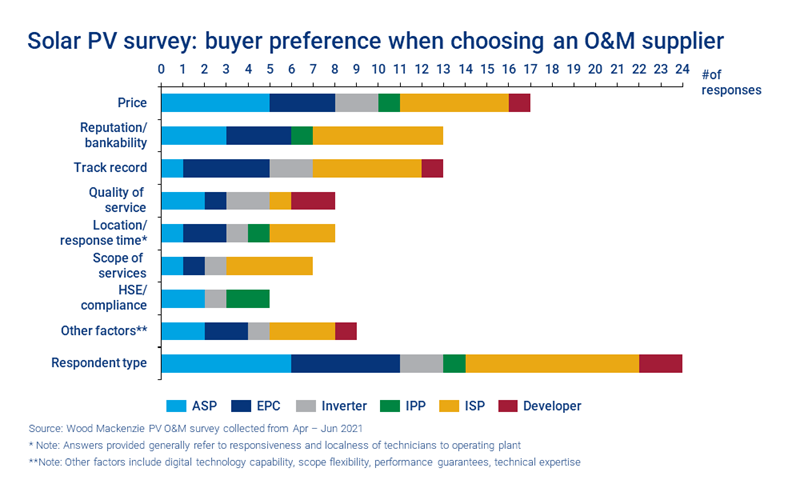
We recently surveyed the 24 biggest solar energy service providers regarding key priorities for operations and maintenance (O&M) contracts. As you can see from the results in the chart below, price was easily the most dominant issue.
Full scope contract price has been steadily declining since we started collecting data in 2017. However, the majority of service providers and asset owners we speak to consider this unsustainable. In fact, many parts of the O&M value chain are already reaching a pricing floor, with minimal profit margins because of competitive pricing pressure.
Solar O&M cost escalation risk is rising
While contract prices are falling, parts of the O&M value chain face significant pressure from rising costs. These include labour wage growth, equipment cost increases, and spare parts shortages. In turn, this has led to increased failure rates. Our analysis of similar factors in the wind sector that wind projects could experience a 1%/yr CAGR increase to O&M costs, weighted on a fleet-wide basis. For solar, the impact on individual project O&M, could be even more significant, given labour demand pressures from the oncoming construction boom.
O&M contract scope is shrinking
Given these competing pressures, scope-reduced O&M agreements are becoming common in the solar sector. These contracts focus on keeping costs down and ensuring a plant is operational day-to-day. But they usually ignore important cost-escalating factors, including corrective maintenance, equipment failures and module cleaning.
Assuming all maintenance is conducted to ensure a utility-scale project runs for its full design lifetime, O&M costs would be US$9.30 per kilowatt DC per year (kW DC/year). Scope-reduced contracts bring that figure as low as US$4.20 kW DC/year, but at what risk to the operational health of assets?
The impact on solar PV operating performance
In our webinar, Hao Shen highlighted both the trickle-down effect of less rigorous maintenance on asset performance and the sector’s failure to account for this in estimating operating performance. “While the scope and budget of O&M is changing, the standard modelling assumptions the solar industry uses have not evolved to reflect that change,” he commented.
Hao identified three crucial assumptions used in the asset financing process that are commonly overestimated, leading to asset underperformance relative to initial production estimates:
1. Inverter availability
Research indicates real inverter availability is lower than the standard model assumption of 99%, especially if the manufacturer is defunct. Notably, reduced O&M budget and scope means inverter failures are addressed more slowly, exacerbating the problem.
2. System degradation
System degradation can have a compounding effect on performance, resulting in a precipitous decline in production over a typical 25-year asset lifespan. The standard industry assumption is an annual derating of 0.5%, but analysis of actual performance puts the true figure closer to -1% annually for utility-scale assets in the US. Over 25 years, this results in nearly a 10% performance difference between modelled and actual degradation.
3. Soiling
Analysis from Fracsun, a soiling measurement and management company, found there was a 99.5% error rate for independent engineers’ soiling estimates compared to actual soiling for over 50 US solar assets. In short, soiling estimates do not reflect actual soiling.
Overestimations like these result in overall asset underperformance over a project’s lifetime. For example, kWh Analytics’ Solar Generation Index, which uses data from 10 of the top 15 US asset owners, found that solar assets underperformed their production estimates by 6.3% on average from 2016-2019, even after adjusting for the impact of weather.
How solar PV asset owners are reacting to the challenge
According to Hao Shen, asset owners are reacting to the issue in very different ways. While some are simply ‘waiting and hoping’ for asset performance to turn around, others are taking a much more proactive approach.
“There are two ways that we've seen asset owners go about this. First, by identifying positive ROI opportunities in the O&M space to improve performance and applying remedial action. And second, by seeking insurance solutions, like the Solar Revenue Put, to address operating risks and protect their equity returns,” he said.
In terms of operational efficiency gains, the industry needs to make a step-change in asset management practices. Wood Mackenzie’s own analysis indicates that 60% of the PV O&M value chain is ripe for digital disruption – specifically, preventative maintenance, corrective maintenance and inverter replacement can all be made more efficient in this way. Solutions with the most potential include analytics platforms, aerial thermography and autonomous drone inspections.
Don’t forget to download our webinar presentation slides. This pack includes detailed charts and analysis of how end-to-end digital solutions can unlock operational cost efficiencies in the solar industry.
Fill in the form at the top of the page for your complimentary copy.


