Get in touch
-
Mark Thomtonmark.thomton@woodmac.com
+1 630 881 6885 -
Hla Myat Monhla.myatmon@woodmac.com
+65 8533 8860 -
Chris Bobachris.boba@woodmac.com
+44 7408 841129 -
Angélica Juárezangelica.juarez@woodmac.com
+5256 4171 1980 -
BIG PartnershipWoodMac@BigPartnership.co.uk
UK-based PR agency
U.S. solar market sees best Q1 in history
WoodMac and SEIA release the latest U.S. Solar Market Insight Report
4 minute read
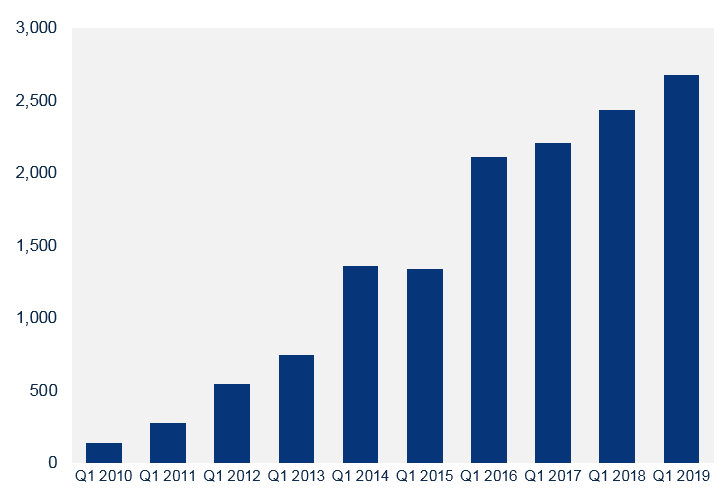
In the first three months of the year, the U.S. installed 2.7 gigawatts of solar photovoltaics (PV), making it the most solar ever installed in the first quarter of a year. With the strong first quarter, Wood Mackenzie Power & Renewables forecasts 25% growth in 2019 compared to 2018, and it expects more than 13 GWdc of installations this year.
This data comes from the new U.S. Solar Market Insight Report from Wood Mackenzie and the Solar Energy Industries Association (SEIA), whom together announced in May that the U.S. hit the 2 million solar installation milestone during the first quarter of 2019.
“The first quarter data and projections for the rest of the year are promising for the solar industry,” said Abigail Ross Hopper, president and CEO of the Solar Energy Industries Association. “However, if we are to make the kind of progress we need to make the 2020s The Solar Decade, we will need to make substantial policy and market advances.”
FIGURE: U.S. PV capacity installed in the first quarter, Q1 2010 – Q1 2019 (MWdc)
Source: Wood Mackenzie / SEIA U.S. Solar Market Insight Report, Q2 2019
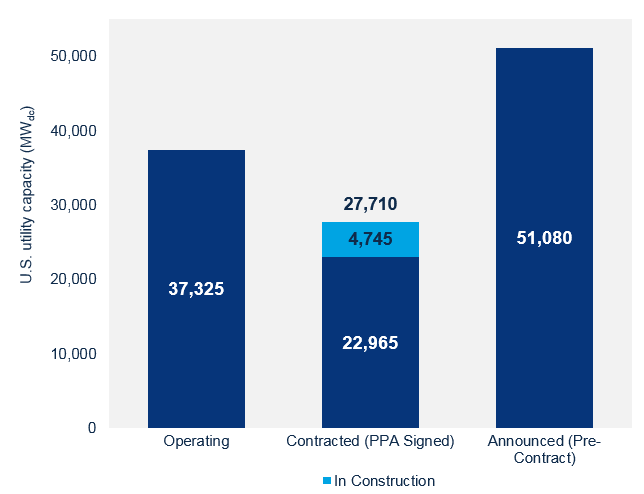
The largest share of installations during the record-breaking quarter came from the utility PV segment, with 1.6 gigawatts coming on-line, making up 61 percent of PV capacity installed. The report notes that with 4.7 gigawatts of large scale projects under construction, 2019 is on track to be a strong year for utility PV, with 46 percent growth over 2018 expected.
FIGURE: U.S. Utility PV Pipeline, Q2 2019
Source: Wood Mackenzie / SEIA U.S. Solar Market Insight Report, Q2 2019
“Voluntary procurement of utility PV based on its economic competitiveness continues to be the primary driver of projects announced in 2019,” said Wood Mackenzie Senior Solar Analyst Colin Smith. “While many states, utilities and cities have announced or proposed 50 or 100 percent renewable energy or zero-carbon standards, the announcements have not yet resulted in an uptick in RPS-driven procurement,” added Smith.
The residential market experienced annual growth as well.
According to the report, the U.S. saw 603 megawatts of residential solar installations during the first quarter, up 6 percent annually.
“Despite steady installations in Q1 2019, the residential market is still highly reliant on legacy state markets, such as California and the Northeast, which have seen only modest to flat growth over the past several quarters,” said Wood Mackenzie Solar Analyst Austin Perea. “As these major state markets continue to grow past early-adopter consumers, higher costs of customer acquisition will challenge the industry to innovate product offerings and diversify geographically,” continued Perea.
In fact, the report notes that 29 percent of residential capacity in Q1 2019 came from markets outside the top 10 solar states by capacity, the highest share for emerging markets in industry history.
The non-residential segment, which represents commercial, industrial and public sector distributed solar, saw 438 megawatts of PV installed on the quarter, which was down on both a quarterly and annual basis. According to the report, this is largely a result of state-level policy reforms in historically strong markets for the segment including California, Massachusetts and Minnesota. The authors point to new community solar mandates in New York, Maryland, Illinois and New Jersey that will help reinvigorate the segment beginning in 2020.
Total installed U.S. PV capacity will more than double over the next five years, with annual installations reaching 16.4 GWdc in 2021 prior to the expiration of the residential federal Investment Tax Credit (ITC) and a drop in the commercial tax credit to 10% for projects not yet under construction.
Key findings from this quarter’s report include:
- In Q1 2019, the U.S. solar market surpassed 2 million installations – just three years after the market surpassed the 1 million installation milestone. The industry is expected to hit 3 million installations in 2021 and 4 million installations in 2023.
- In Q1 2019, the U.S. solar market installed 2.7 gigawatts of solar PV, marking the largest Q1 ever recorded. This represented a 37% decline from Q4 2018 and a 10 percent increase from Q1 2018.
- Residential solar continues its modest rebound, with a third consecutive quarter of more than 600 megawatts of installed capacity.
- Non-residential PV saw 438 megawatts installed – its lowest quarter since Q1 2017 – as policy shifts in states like California, Massachusetts and Minnesota continue to hamper growth.
- There were 1.6 gigawatts of utility-scale solar installed in Q1 2019, accounting for 61 percent of U.S. capacity additions this quarter.
- Wood Mackenzie Power & Renewables forecasts 25% growth in 2019 compared to 2018, and it expects more than 13 GWdc of installations
- Total installed U.S. PV capacity will more than double over the next five years, with annual installations reaching 16.4 gigawatts in 2021 prior to the expiration of the residential federal Investment Tax Credit (ITC) and a drop in the commercial tax credit to 10% for projects not yet under construction.
For more insight, download the free executive summary here.


