


Lead Mines, Smelters and Refineries Wallmap
This report is currently unavailable
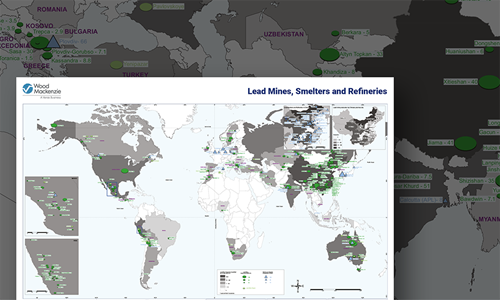
Summary
Our detailed wallmap of the world’s Lead mines, Smelters and Refineries.
This map gives you a rapid appreciation of:
- The location of the world’s lead mines,smelters and refineries
- The capacity in Kt/a of each mine and smelter
- Lead mine production by country
Every mine, smelter and refinery is named and is proportionally represented on the map according to its capacity, to show its relative importance.
Detailed inset maps show the key producing areas of China, Mexico and Peru. In addition, each country is colour-coded according to its lead mine production.
The map includes the following informative charts: lead mine production by country, lead smelter production by country, and Chinese lead production growth.
This map is an invaluable reference for anyone interested in the global lead industry. Wallmaps bought online will be couriered to you within 5 days.
Why buy a wallmap?
Our maps bring together trusted data and research from across the globe. And we have a team of analysts and researchers committed to ensuring the continued accuracy and consistency of data across the entire collection. With a Wood Mackenzie map, you can:
- Gain an instant visual appreciation of multiple assets and markets across global locations.
- Use them as reference documents in group discussions
- Get a single, reliable overview
What will you receive?
- Printed to make a big and lasting impression, each map is 84cm x 120cm or 33 inches x 46 3/4 inches on high quality paper
- Couriered to you when purchased online
- Delivered in a tough cardboard tube to ensure maps reach you in pristine condition
Other reports you may be interested in
Global copper smelter and refinery cost summary
A detailed analysis and forecast for production, costs, revenue and margins for copper smelters and refineries.
$6,750A Bold Leap Forward with Lens Metals & Mining
Dive in to see what sets Lens M&M apart and how it can help you drive strategic decisions.
$1,0502025 zinc benchmark TC: a new era or a strategic move?
The 2025 annual zinc benchmark contract treatment charge is understood to have been settled. Was this a strategic move by smelters?
$1,050


