


Global solar PV installed capacity will more than triple in the next ten years
The world will have 5.7 TWdc of solar by 2033, largely driven by China
4 minute read

Juan Monge
Principal Analyst, Distributed Solar, Europe

Juan Monge
Principal Analyst, Distributed Solar, Europe
Juan covers distributed solar market developments across Europe.
Latest articles by Juan
-
Opinion
European Power & Renewables: what to look for in 2026
-
Opinion
European Power & Renewables: what to look for in 2026
-
Opinion
Global solar PV installed capacity will more than triple in the next ten years
-
Opinion
Global solar forecast gets an upgrade
-
Opinion
Chinese state-owned enterprises are the largest owners of solar assets
-
Opinion
Western Europe will drive 46% of the continent’s solar in the next ten years
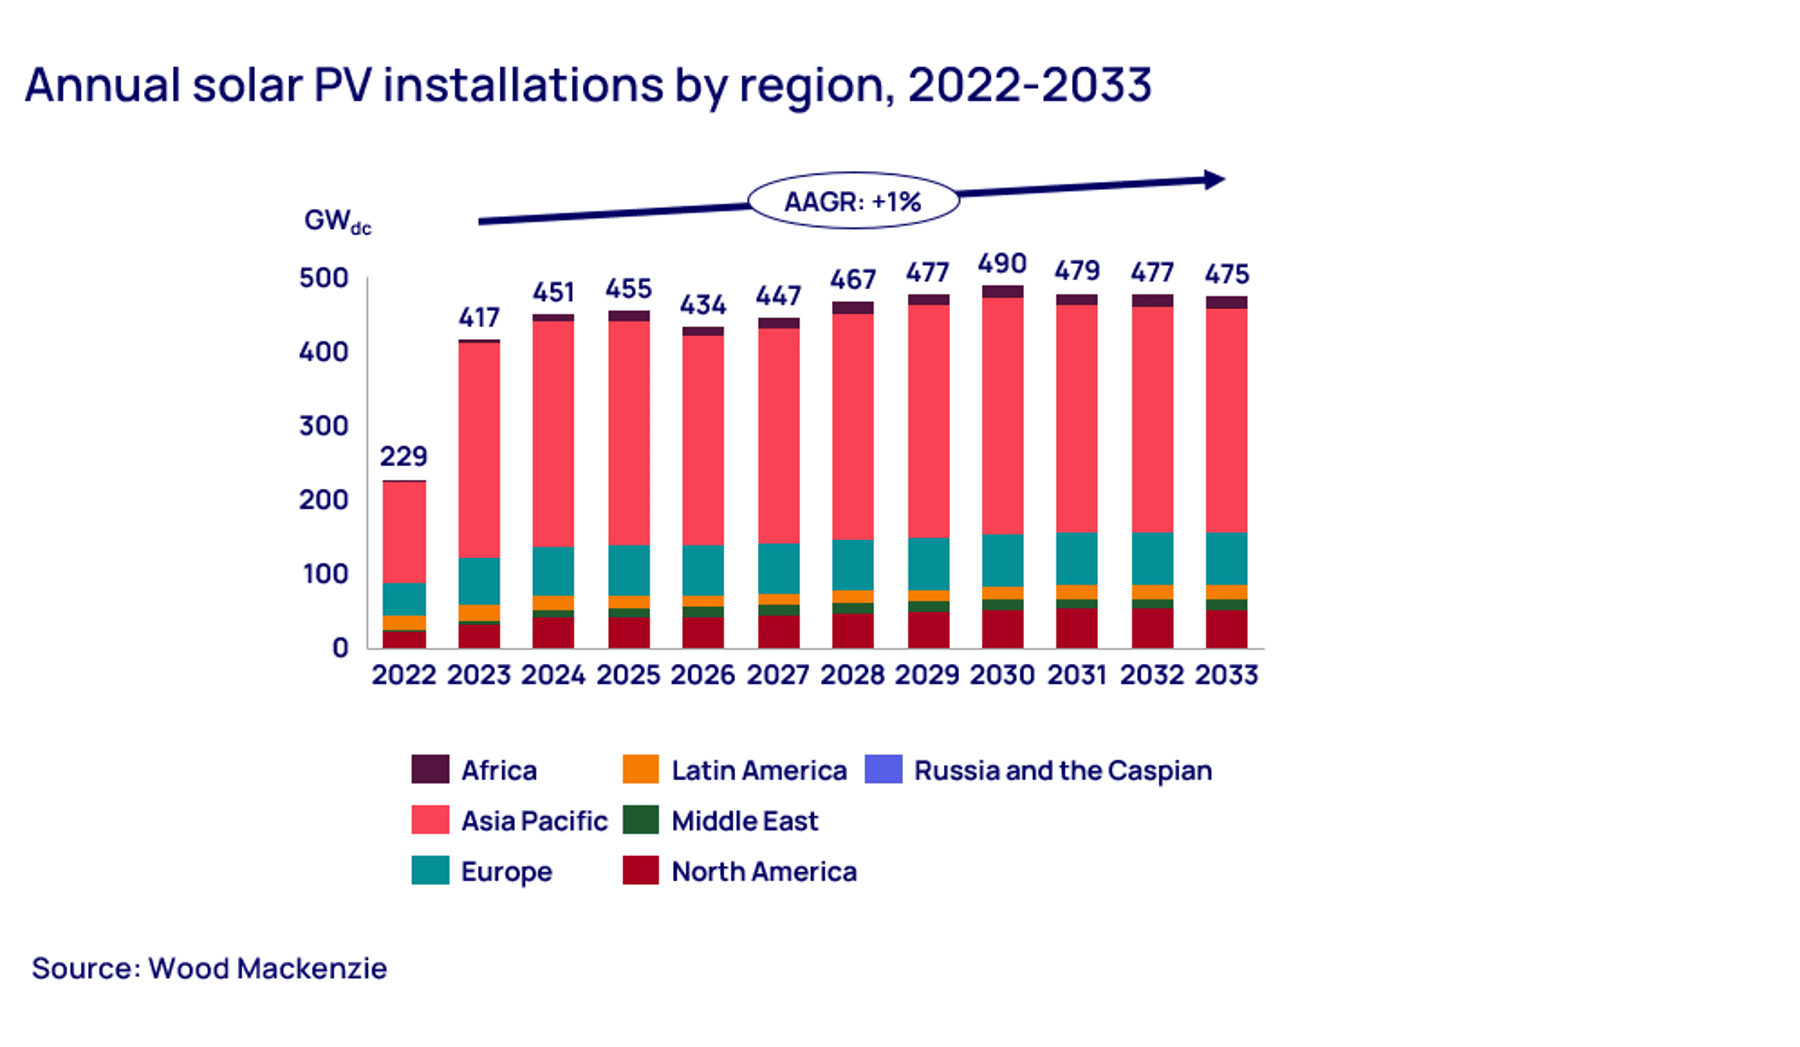
Global solar PV annual installations grew by over 80% in 2023 compared to 2022, reaching 417 GWdc of grid-connected installed capacity. Ultra-low solar PV module prices intensified the rate of deployments in Europe and China. China remains the top market by a large margin, contributing over 60% of global installed capacity last year.
Decarbonisation pledges at a government and corporate level remain key drivers of the exponential solar PV growth across territories. Strict interconnection deadlines for contracted auctioned projects, along with growing electricity demand, will translate into double-digit growth in our near-term forecasts for markets like Malaysia, Taiwan, Saudi Arabia and Iran. The need for energy-intensive industries to hedge against electricity price volatility keeps fuelling the C&I solar PV development boom as well as offsite and onsite PPAs across European markets.
Developed by WoodMac’s team of regional experts located in every major territory, our ‘Global solar PV market outlook update’ covers the global trends and regional variations that inform our forecasts, helping the industry better understand this fast-paced, fundamental sector in the energy transition. Fill in the form to access your complimentary extract of the report, or read on for some key highlights.

China’s slowing growth drives our flat outlook for global solar PV in the next decade
We expect at least 430 GWdc of global solar PV installed in 2024, reflecting 3% growth over 2023.
But despite the strong growth in global solar over the last few years, we expect average annual growth to be flat over the next ten years. This is being driven almost entirely by our outlook for China. We expect modest deployment growth in 2024 and 2025 as subsequent “RE” bases (dedicated areas for renewable energy development facilitated by Chinese authorities) are expected to interconnect on schedule.
However, we expect a 9% decline in China’s installations in 2026: as the current batch of projects under the last national plan is completed, there will be a pause in development activity before the next round of planned procurement drives higher deployment volumes in 2028.
Historically, the initial years of these national infrastructure development plans are characterised by policy adjustments and a more cautious approach to project investments by solar developers and financiers. Longer-term, additional capacity will be limited by transmission infrastructure and grid capacity constraints.
There could be upside to our outlook for China. In our Bull case for the country, an additional 600 GWdc would be installed over the next ten years, a 24% increase from our Base case. Our Bull case assumes a more optimistic outlook for solar manufacturing capacity in the country. If manufacturing capacity increases more than we currently expect and solar module prices stay at their current ultra-low levels, this could drive additional capacity.
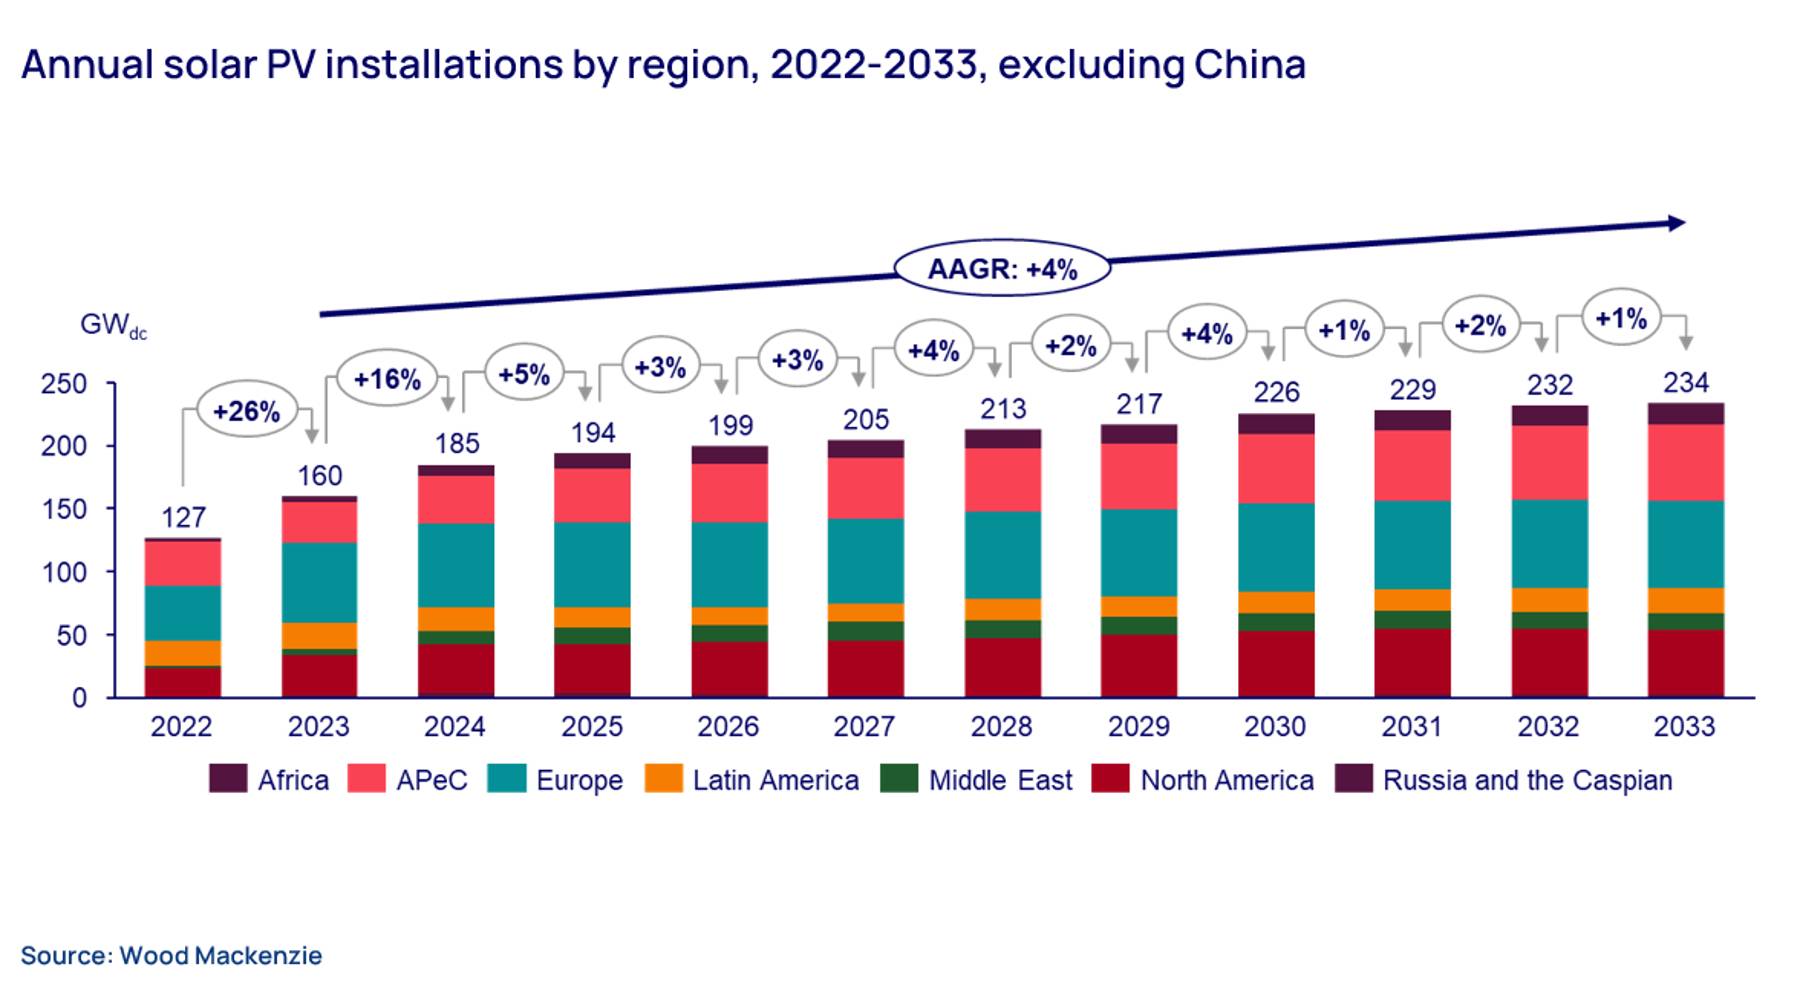
When looking at our global solar outlook excluding China, we anticipate modest levels of growth – 4% on average in the next ten years. While markets like the Middle East and Africa achieve average annual growth in the 12-14% range, growth in Europe and Latin America is relatively flat.

Insufficient grid infrastructure, sluggish demand and protectionism limit growth potential
Critical transmission and distribution grid expansions and upgrades remain the biggest limiting factor to more solar growth. In Europe, where capacity additions grew by over 40% last year compared to 2022, grids cannot keep up with the rapid expansion of solar generation. The European Union estimates 600 billion euros of grid investment is needed per year to meet decarbonisation goals and allow large-scale renewables and decentralised solar PV resource capacity growth to be maintained through the decade.
But grid infrastructure announcements are lagging. Similar bottlenecks are worsening in all other regions, with connection timelines reaching over 10 years in some countries. The lack of grid expansions and upgrades is particularly acute in South America, where a lack of transmission constrains the near and mid-term outlooks.
Slowing electricity demand growth also impacts our longer-term outlooks for solar. Slower-than-anticipated progress on transportation and heating electrification trends and limited electricity demand growth will suppress the rate of installations in Europe through the decade.
The solar procurement boom of the last two years has relied on record-low Chinese solar module prices, but growing protectionist sentiment and looming trade defence measures could jeopardise the competitiveness of solar economics in certain markets. The European Commission has defined the details of the Net Zero Industry Act in an effort to ramp up domestic production of critical renewables technologies. Also, Canada recently passed an act that will require efforts to demonstrate that their supply chains are traceable and free of forced labour. These policies will likely result in near-term import restrictions that could suppress growth in the next few years.
Learn more
To find out more about global solar market trends, and gain access to charts detailing regional variations, please fill out the form at the top of the page to download your complimentary extract from our Global Solar PV Market Update.