How do integrated companies position themselves in the changing downstream landscape?
We benchmark 17 integrated IOCs and NOCs in our coverage using our proprietary downstream analysis in our Corporate Strategy and Analytics Service.
2 minute read
Yuqi Hu
Senior Analyst, Corporate Research

Yuqi Hu
Senior Analyst, Corporate Research
Yuqi is a Senior Consultant on the Corporate Research team. She has worked at Sinopec, Aramco and Clariant.
Latest articles by Yuqi
-
Opinion
How do integrated companies position themselves in the changing downstream landscape?
-
The Edge
Big Oil’s opportunity for M&A in the petrochemicals downturn
-
Opinion
Are NOCs prepared for the energy transition?
Tom Ellacott
Senior Vice President, Corporate Research

Tom Ellacott
Senior Vice President, Corporate Research
Tom leads our corporate thought leadership, drawing on more than 20 years' industry knowledge.
Latest articles by Tom
-
The Edge
Majors' capital allocation in a stuttering energy transition
-
Featured
Corporate oil & gas 2025 outlook
-
The Edge
The complexity of capital allocation for oil and gas companies
-
Opinion
Ten key considerations for oil & gas 2025 planning
-
Opinion
Can ExxonMobil make attractive returns from its US CCUS portfolio?
-
Opinion
How do integrated companies position themselves in the changing downstream landscape?
Alan Gelder
SVP Refining, Chemicals & Oil Markets

Alan Gelder
SVP Refining, Chemicals & Oil Markets
Alan is responsible for formulating our research outlook and cross-sector perspectives on the global downstream sector.
Latest articles by Alan
-
Opinion
The impact of the Israel-Iran conflict escalation on the global energy market
-
Opinion
Oil and refining market implications of Israel’s strike on Iran
-
Opinion
What is the impact of US tariffs on oil and refining?
-
Opinion
Oil and refined products in 2025: a commodity trader’s guide
-
Opinion
Global refinery closure outlook to 2035
-
The Edge
What a future Ukraine peace deal means for energy (Part 2)
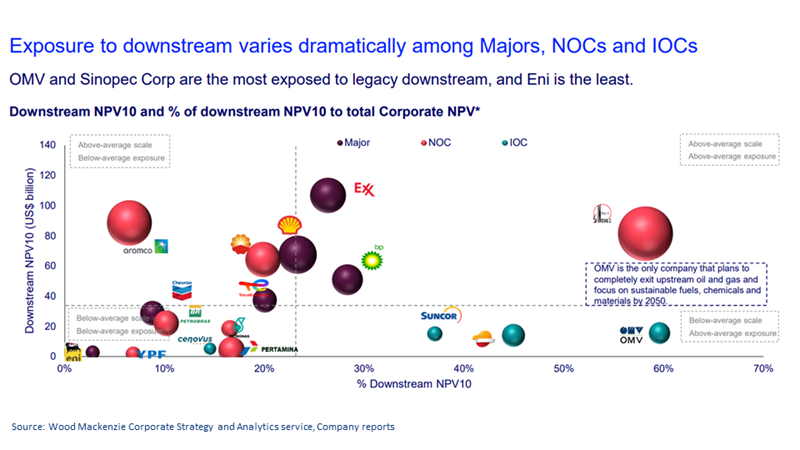
Downstream accounts for an average of US$37 billion or a quarter of integrated companies’ net asset value. It has a vital role to play in future corporate performance. In a recent report corporate downstream benchmarking we use forward-looking proprietary downstream metrics to provide unique insight into the evolution of portfolios and performance of 17 integrated oil companies (IOCs) and national oil companies (NOCs).
The full report forms part of ours Corporate Strategy and Analytics Service. Read on for some of the key messages from the analysis and fill in the form to download an extract from the report.
What is the downstream contribution to integrated companies?
Relative exposure to different segments and regions has impacted individual performance across peer groups. ExxonMobil has the world’s most valuable downstream business at US$107 billion (NPV10 basis), accounting for a third of the company’s total value. OMV and Sinopec Corp are the most exposed to legacy downstream (about 60% of total value), while Eni is the least (3%).
Refining is the main cash engine for most companies’ downstream businesses, accounting for around about half of the forecast downstream EBITDA for 2024 to 2030. Meanwhile, petrochemicals contribution to downstream EBITDA jumps from 10% in 2024 to 22% in 2030 as margins expand.
Which peer groups invest the most in downstream?
The NOCs account for 54% of the organic downstream spend in our peer group during 2017-2023. Sinopec Corp is the largest downstream investor globally, while Shell invested the most among Majors during the period. The Majors are high-grading their downstream portfolio and plan to decrease downstream capex by 8% y-o-y in 2024. In contrast, IOCs and NOCs will increase downstream spend by 6% and 9% respectively.
Majors’ downstream return on average capital employed (ROACE) has consistently outperformed group returns since 2017. However, downstream hasn’t delivered the same returns outperformance for the NOCs and IOCs, as NOCs typically have lower quality downstream assets.
Who are the leaders in legacy refining, petrochemicals and retail?
Refining: Some NOCs such as Sinopec and PERTAMINA are growing crude refining capacity, while the Majors are high grading their portfolios. The Canadian Independents and BP will benefit from above-average unit net cash margins until the end of this decade, while companies with Euro-centric portfolios will be hit hard by falling margins this decade due to increasing emission costs.
Petrochemicals: Companies with material positions in chemicals will continue to grow their ethylene capacity, led by Sinopec and PetroChina. PetroChina, PETRONAS, Chevron and Sinopec will experience the largest rise in ethylene net margins. Various strategic chemical projects (e.g. the multi-billion-dollar Huizhou project in China) will support ExxonMobil’s cash flow growth.
Retail and marketing: The covered companies have expanded retail sites the most in APAC but shrunk portfolios the most in South America. Shell is the world’s largest retailer but downgraded its previous growth ambition in marketing.
What’s next?
Companies need to weigh various options to accelerate the repositioning of their portfolios for longer-term growth, such as cost reduction, biofuels and circular plastics expansion.
Our downstream modelling combines bottom-up, Wood Mackenzie asset-level forecasts with top-down company-reported financial data. Our Corporate Strategy and Analytics Service includes Corporate-level strategic analysis and portfolio benchmarking of Oil & Gas, Power & Renewables and Metals & Mining sectors to underpin board-level decisions.
Don’t forget to fill in the form to download an extract of the report which includes more analysis.


