


Need to know: North American natural gas in Summer 2026
From natural gas production expectations to LNG production ramp-up and the impact of the Iran war on US LNG exports, the information you need as a trader
1 minute read

Eric McGuire
Director of Natural Gas and LNG Analytics

Eric McGuire
Director of Natural Gas and LNG Analytics
Eric is a Director of Research, overseeing Wood Mackenzie’s North America S&D team.
Latest articles by Eric
-
Opinion
Need to know: North American natural gas in Summer 2026
-
Opinion
European natural gas: your top seven questions answered
-
Opinion
European natural gas winter outlook 2025
-
Opinion
The fundamentals behind summer’s strong gas injections
-
Opinion
North American oil & gas commodity data: how does WoodMac compare to EIA?
-
Opinion
Dynamics shaping the European natural gas market

Randall Collum
Senior Vice President, Commodity Trading Data and Analytics

Randall Collum
Senior Vice President, Commodity Trading Data and Analytics
Randall is an experienced analyst with more than 20 years of experience in natural gas and oil production analytics.
Latest articles by Randall
-
Opinion
Need to know: North American natural gas in Summer 2026
-
Opinion
What growing demand and large-load dynamics mean for US gas and power
-
Opinion
North America natural gas summer market outlook – 2025
-
Featured
Oil, power, gas trading 2025 outlook
-
Opinion
4 critical moments for North American oil and gas trading
-
Opinion
5 factors affecting North American natural gas markets this winter

Kyle Cooper
Research Director – SME Short Term Gas

Kyle Cooper
Research Director – SME Short Term Gas
Leads short-term North American gas forecasting, specialising in weather impacts, demand trends and storage estimates
Latest articles by Kyle
-
Opinion
How gas and power markets are inextricably linked in 2026
-
Opinion
Need to know: North American natural gas in Summer 2026
With the structural forces of LNG export growth, AI-driven power load and gas-as-the-balancing-fuel driving pricing, North American gas demand is now global, power-linked and infrastructure sensitive. To navigate an increasingly complex landscape in which price formation spans production, LNG and power, traders need their finger on the pulse of this complex web of factors.
Our expert North American gas and LNG analysts recently presented our summer North American natural gas outlook webinar for subscribers to our gas and LNG trading analytics. Fill out the form on this page to download the slide deck from that event, or read on for a brief overview of the topics covered.
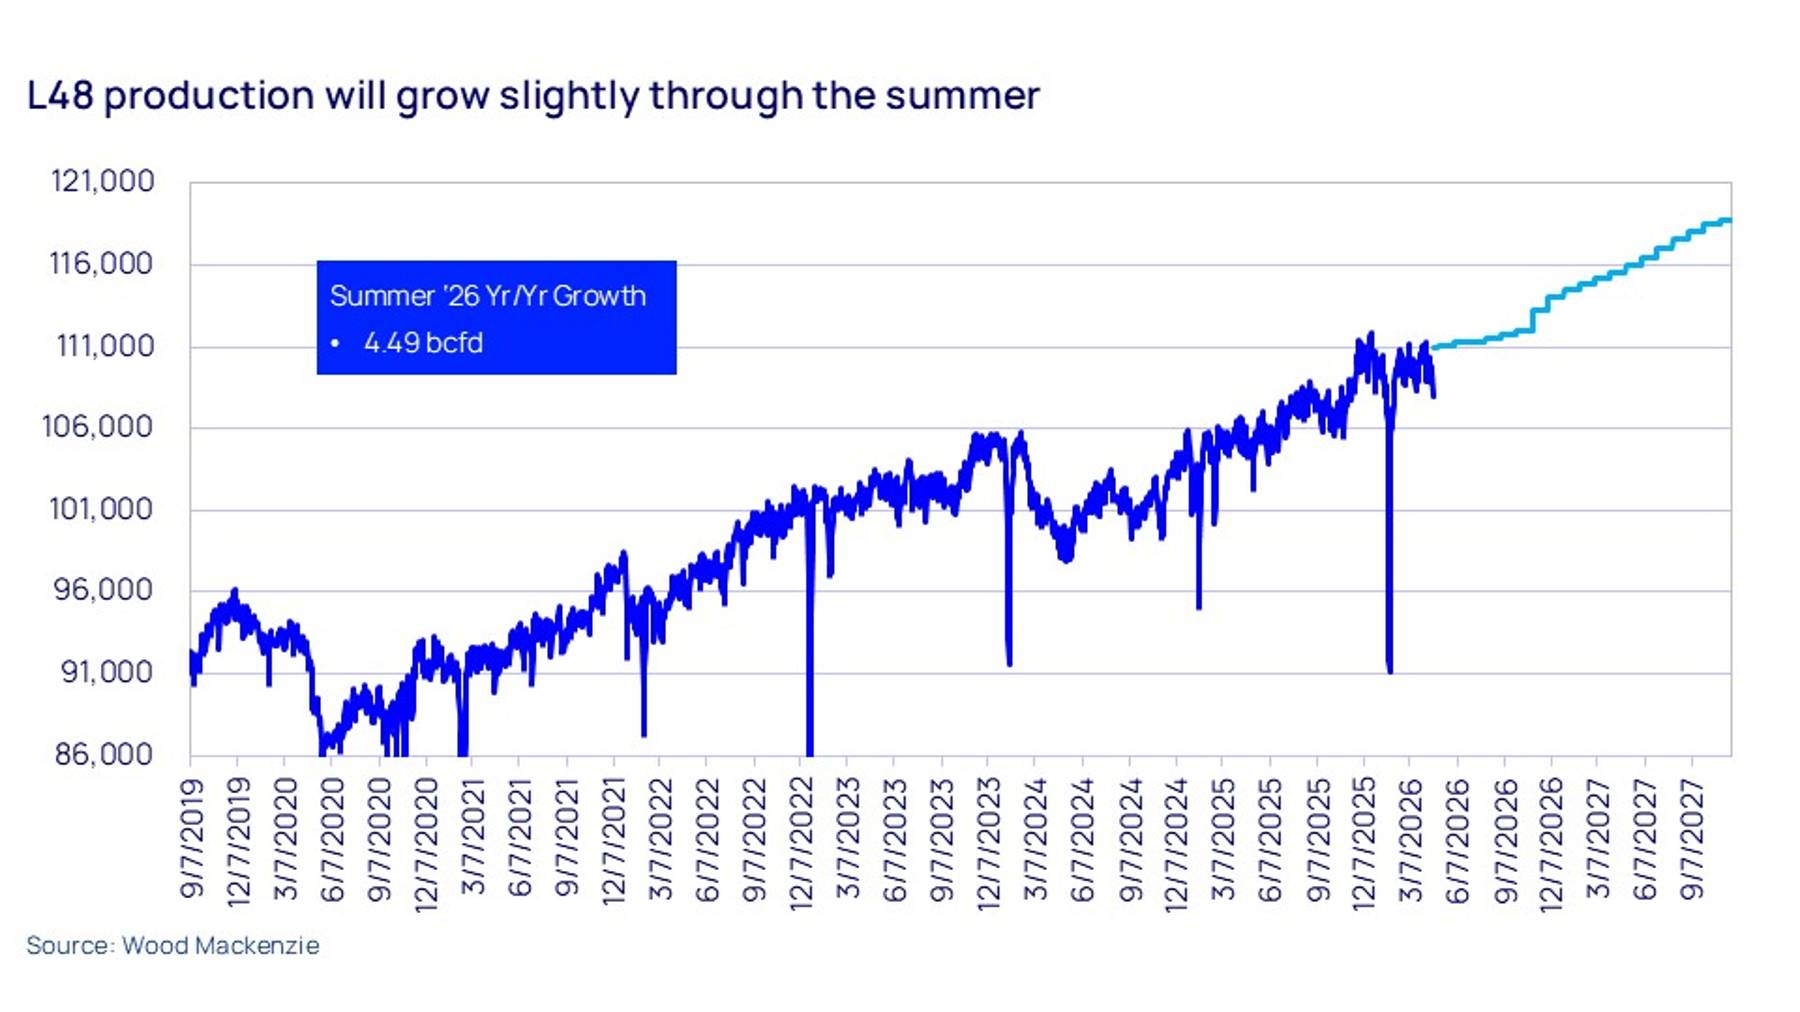
Summer production expectations: expect slight growth in Lower 48 production
US natural gas production growth will be limited this summer, mainly due to pipe capacity issues across several regions, including the Permian Basin and the Northeast.
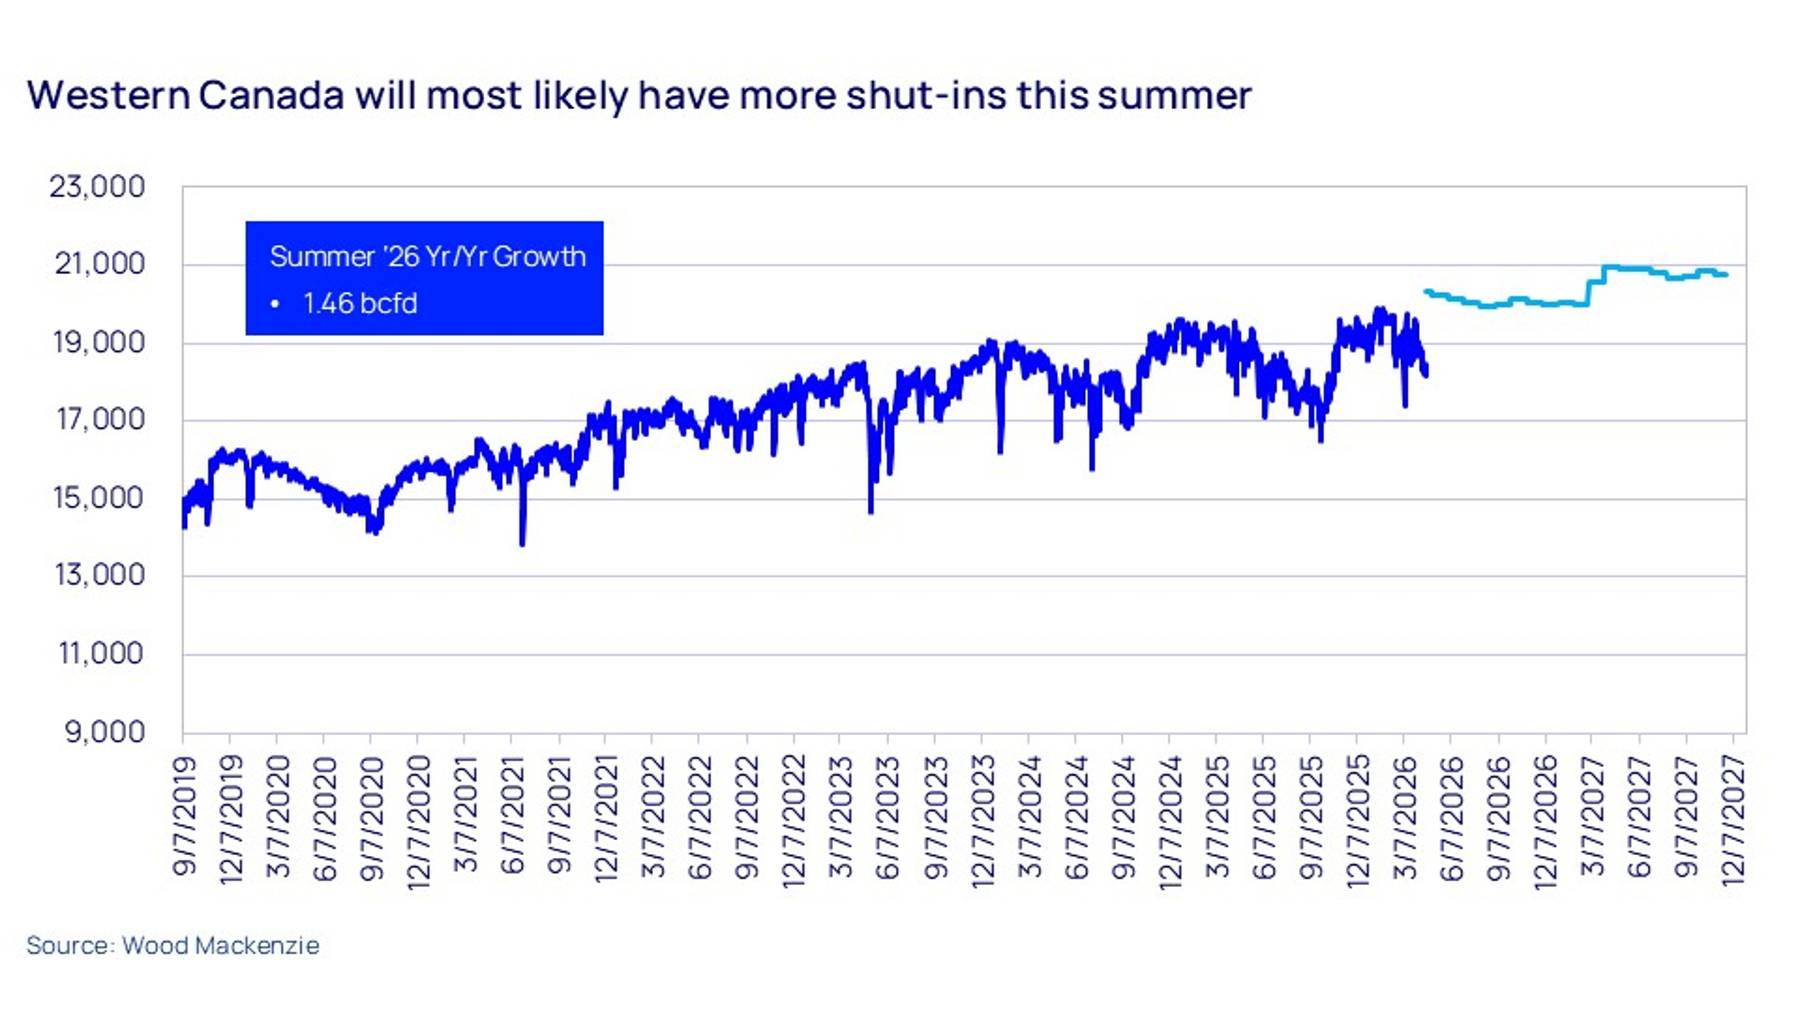
Lower 48 production will be driven by Haynesville, Permian, Eagle Ford and Marcellus/Utica, with slight growth mainly coming from Eagle Ford Shale. As in previous summers, expected prices will create the risk of shut-ins, particularly in Marcellus/Utica and in Western Canada. However, production should bounce back up at the end of the year once pipeline constraints are alleviated.


LNG outlook: Corpus Christi and Golden Pass are set to add capacity
Usually LNG events are bearish — hurricane disruptions and other impacts can easily take away several billion cubic feet of production. However, two major US projects are bringing additional capacity online in 2026. Train 6 (of 7) at Cheniere Energy’s Corpus Christi is already testing, with startup expected in May 2026, while we expect Train 7 (the last) to be operational in July or August. Meanwhile, Train 1 at Golden Pass LNG should ramp up to 800 million cubic feet per day by June, with the first liquefaction from Train 2 in Q4 2026.
Mexico outlook: Strong growth driven by the power sector
Mexican production is set for substantial, structural growth this summer, driven mostly by the power sector both domestically and in the US. At the same time, despite delays, Phase 1 of the Energia Costa Azul Liquefaction project will drive a step change in feed gas demand. However, there are risks to this scenario: new power demand is subject to potential project delays; production spikes could trigger gas-to-gas competition against Mexican exports; and another rainier-than-expected summer could dampen demand.
Lower 48 demand: Residential electricity is a key driver
Total Lower 48 gas demand remains strong. A key factor is the increasing size of residential properties — both in terms of square footage and ceiling height (higher ceilings help cooling in the summer as heat has space to rise, but create higher demand from heating in the winter, leading to increasing day-to-day volatility in winter). Solid overall electricity demand growth means natural gas generation is essential to keep the grid stable, a bullish factor for long-term gas demand that will at least partly offset increasing supply.
Iran war impacts: Risk could create an energy security premium
In the short-to-medium term, significant damage to facilities at the huge Ras Laffan export hub in Qatar is having a significant and ongoing impact on global LNG supply. Full restoration of production could take up to five years, putting a floor under prices for US LNG exports and reducing price-related risk for new projects. Beyond the impact on pure economics, the conflict is also likely to intensify the focus on energy security, potentially making the US more attractive to energy-intensive industries and further boosting demand growth.
Remember to fill in the form at the top of the page to download the full presentation from the webinar. This includes a wide range of charts and data, as well as more detail on changes to power sector demand and generation and our storage expectations for the summer period.
You may also like to find out more about Wood Mackenzie connected intelligence across the pricing chain, including our Commodity Trading Analytics, Lens Gas & LNG and Power Trading Analytics products.