Benchmarking 2023’s upstream FIDs
Capital discipline and carbon mitigation will be key elements of final investment decisions for upstream oil and gas projects this year
2 minute read
Fraser McKay
Head of Upstream Analysis

Fraser McKay
Head of Upstream Analysis
As head of upstream research, Fraser maximises the quality and impact of our analysis of key global upstream themes.
Latest articles by Fraser
-
Opinion
Global upstream update: diverging development strategies in Latin America, investment at risk in Africa, and Kazakhstan supply tensions explained
-
Opinion
Is oil price volatility a threat to upstream production, investment and supply chains?
-
Opinion
Global upstream update: UK fiscal changes and an Asia-Pacific licence bonanza
-
Opinion
Global upstream update: the global sanctions slump, grappling with gas and potential US tailwinds
-
Opinion
Global upstream update: the global sanctions slump, grappling with gas and potential US tailwinds
-
The Edge
Why upstream companies might break their capital discipline rules
Greg Roddick
Principal Analyst, Upstream

Greg Roddick
Principal Analyst, Upstream
Greg has almost 15 years of industry experience, focused on corporate strategy, fiscal modelling and economic analysis.
Latest articles by Greg
-
Opinion
North Sea upstream: 5 things to look for in 2025
-
Opinion
Benchmarking 2023’s upstream FIDs
-
Opinion
Has Norway’s oil and gas tax stimulus been a success?
-
Opinion
UK energy exports and fracking: aspiration or pipe dream?
Achieving final investment decision (FID) on oil and gas projects is harder than it used to be. Despite a continued uptick in activity since the pandemic nadir of 2020, fewer major projects were sanctioned in 2022 than was expected at the start of the year.
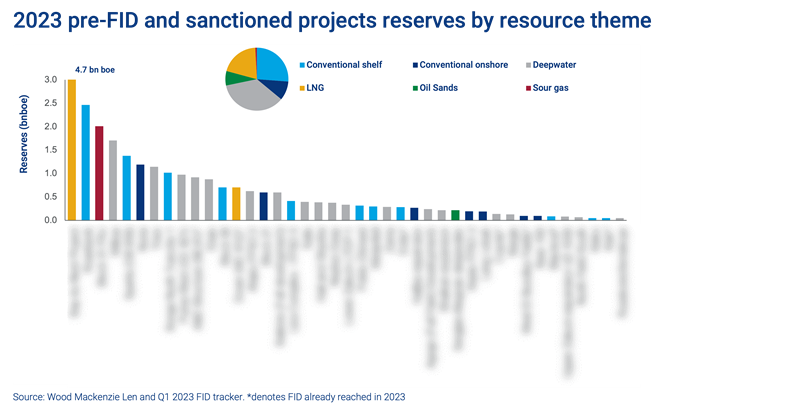
In 2023, we believe more than 30 of the 40+ viable major projects are likely to reach FID. Several could be delayed and re-evaluated due to ongoing cost inflation; most operators will remain very disciplined. A handful of lower-return projects will proceed because of their strategic importance.
In a recent report, Class of 2023: benchmarking this year’s upstream FIDs, which draws on insights from Lens Upstream we examine how the class of 2023 fares on emissions metrics, which companies and resource themes are likely to drive new investment and how cost inflation is impacting breakeven prices and returns. Fill in the form to receive a complimentary extract and read on for a brief introduction.
NOCs control the largest investment opportunities
Up to US$185 billion of investment could be committed to develop 27 billion boe of reserves. National oil companies (NOCs) will dominate the year as they take advantage of huge discovered resources and boast the lowest unit costs. The average unit development cost of US$7/boe in 2023 is down slightly on 2022.
The international oil companies (IOCs) will focus largely on higher-cost, higher-return deepwater developments. All will be acutely aware of how oil and gas project sanctions are playing out in the public domain and the scrutiny to which their associated emissions will be subject.
Robust project economics and comparatively favourable emission intensities
Projects in 2023 will require an average of US$49/bbl to generate a breakeven 15% internal rate of return (IRR). However, a weighted average IRR of 19%, at US$60/bbl, would be the lowest level since 2018.
Rapid paybacks will also be a key economic indicator. The average for this year’s projects is nine years. Short-cycle and small-scale offshore projects outperform in terms of both paybacks and returns. Long-life LNG projects are compromised when it comes to IRRs but provide attractive and stable future cash flows.
Carbon mitigation will be a key part of any FID for many projects
The class of 2023 emissions intensity of 19 kgCO2 boe is only just below the global onstream average of 22 kgCO2 boe, but similar to that of 2022. Advantaged deepwater oil and shelf projects outperform; LNG, sour gas and some onshore projects require mitigation but have broader Scope 3 advantages.
An aggregate 20% of the NPV10 for 2023 major projects would be at risk under a US$100/tonne hypothetical carbon cost; marginal gas projects are weakest, while deepwater oil is robust.
Fill in the form at the top of the page for a complimentary extract from Class of 2023: benchmarking this year’s upstream FIDs, with a selection of insightful charts, including:
- Project count sanctioned by year
- Project reserve oil and gas split
- IRRs versus payback period from FID
- Scope 1 and 2 emissions intensity versus project FID
- And more.


