Redefining the US ‘solar coaster’
The next few years will be a wild ride for the US solar industry
1 minute read
Michelle Davis
Head of Global Solar

Michelle Davis
Head of Global Solar
Michelle leads our solar research, identifying emerging industry themes and cultivating a team of solar thought leaders.
Latest articles by Michelle
-
Opinion
What could further trade actions mean for the US solar supply chain?
-
Opinion
Sunny skies ahead: the solar market and supply chain in 2024 and beyond
-
Opinion
Our top takeaways from the Solar & Energy Storage Summit 2024
-
Opinion
The US solar industry is off to a strong start in the first quarter
-
Opinion
Is the IRA paying off for the US solar supply chain?
-
Opinion
US solar shattered records in 2023, but will this continue in 2024?
As we approach the end of 2021, the US solar industry is facing both immense challenges and potential fortunes. On the one hand, supply chain constraints continue to escalate, putting gigawatts of projects at risk. On the other, the potential passage of the Build Back Better (BBB) Act, which includes multiple clean energy incentives, is expected to increase solar additions by 31% over the next five years.
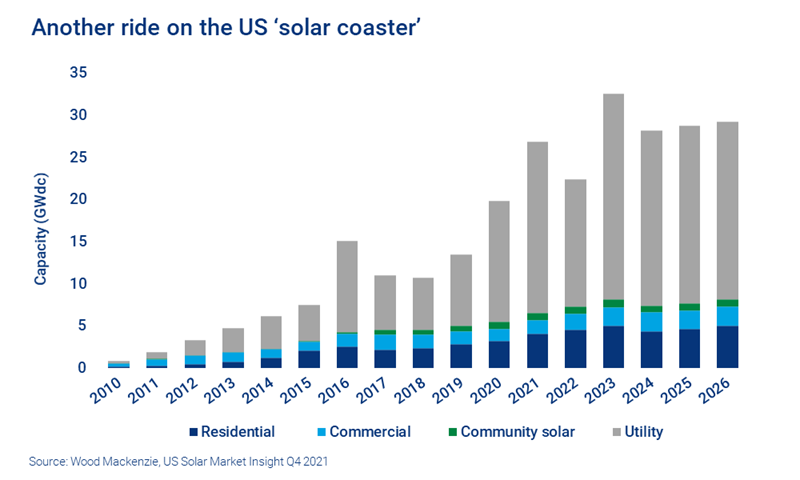
The solar market has never experienced this many opposing dynamics. As a result, Wood Mackenzie is forecasting the biggest fluctuations in near-term solar capacity since 2016, when the investment tax credit almost expired. It’s the solar coaster like we’ve never seen it before.
A full analysis of these complex trends, including forecast scenarios with and without the passage of the BBB Act, can be found in our US Solar Market Insight Q4 2021, created in collaboration with the Solar Energy Industries Association (SEIA). Fill in the form for a complimentary copy of the 17-page executive summary. Or read on for some highlights.
Supply chain constraints reduce 2022 solar capacity expectations by 33%
Supply chain challenges are leading to dips in the current solar coaster. Despite strong installation growth through 2021, 2022 will be a challenging year for the industry. Pricing for installed solar projects increased in Q3, continuing the trend that started in the second quarter of 2021. And equipment procurement remains complicated with considerable uncertainty around equipment availability and delivery times.
Consequently, capacity expectations for next year have been reduced for every segment except residential. Utility-scale solar will be hit the hardest – our 2022 utility-scale outlook has been lowered by 7.5 GWdc, a 33% reduction from last quarter’s outlook. Continued increases in equipment and commodity prices have put many projects at risk. Pricing for fixed-tilt and single-axis tracking utility solar projects have increased 9% and 6% from a year ago, respectively.
The industry got some near-term relief from several recent trade decisions. In November, the US Department of Commerce dismissed petitions to issue anti-dumping and countervailing duties (AD/CVD) on solar cells from Malaysia, Thailand and Vietnam (major solar cell manufacturing nations). The threat of these duties had caused many manufacturers to halt shipments to the US.
Also in November, US Customs and Border Protection clarified language on how to comply with its recent Withhold Release Order (WRO) on solar equipment made with polysilicon from Xinjiang, China. The uncertainty around meeting the WRO’s requirements was also stalling shipments. With some near-term clarity on these issues, shipments should resume, helping partially relieve supply chain constraints. We still expect a reduction in capacity in 2022 but expect continued relief from supply chain constraints to result in a recovery by 2023.
Wood Mackenzie research has determined that an ITC extension would more than double annual solar capacity additions from 2027 to 2030.

Michelle Davis
Head of Global Solar
Michelle leads our solar research, identifying emerging industry themes and cultivating a team of solar thought leaders.
Latest articles by Michelle
-
Opinion
What could further trade actions mean for the US solar supply chain?
-
Opinion
Sunny skies ahead: the solar market and supply chain in 2024 and beyond
-
Opinion
Our top takeaways from the Solar & Energy Storage Summit 2024
-
Opinion
The US solar industry is off to a strong start in the first quarter
-
Opinion
Is the IRA paying off for the US solar supply chain?
-
Opinion
US solar shattered records in 2023, but will this continue in 2024?
An ITC extension would be a major US solar market stimulant over the next decade
Coinciding with this supply chain tumult, the BBB Act is making its way through Congress. The potential policy tailwinds from this legislation would have the solar coaster on a steep upward climb by 2023.
There are multiple goodies in the legislation for the solar industry:
- an increase and extension of the investment tax credit (ITC)
- expandeding eligibility of the production tax credit (PTC) to solar
- an energy storage ITC
- refundability provisions for these tax credits (decoupling tax credit monetization from tax liabilities of project owners).
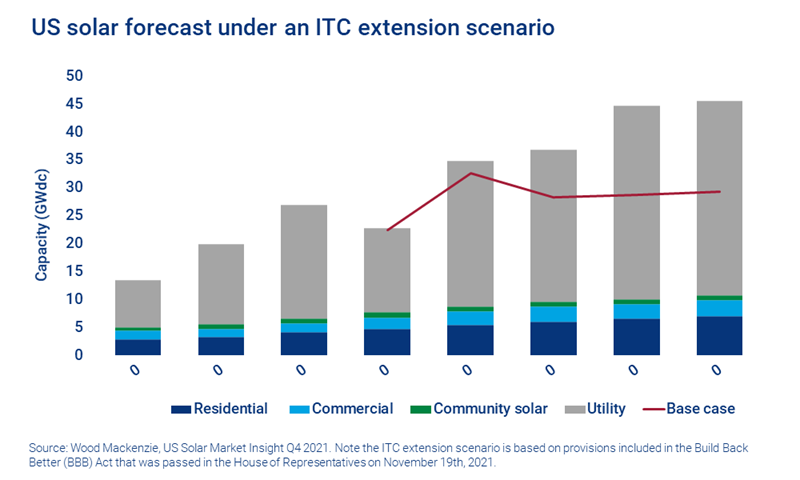
The Q4 edition of our Solar Market Insight includes a forecast scenario that assesses the impact of the BBB Act on the industry (referred to as the “ITC extension scenario”). The Act passed the House of Representatives on 19 November, 2021. If passed, this legislation would represent major upside to the industry. Over the next five years, an estimated 43.5 GWdc of additional solar capacity would be installed, a 31% increase over the base case outlook.
Most of this uplift would come from the utility solar industry. Extended tax credits would continue the current growth momentum in utility solar as more utilities and companies procure renewable energy. Some projects might even opt for the PTC, which can be even richer than the ITC for projects with high capacity factors. Finally, direct payment options for the tax credits will ease financing constraints for smaller developers, expanding the addressable market.
And the upside continues to grow further into the decade. Wood Mackenzie research has determined that an ITC extension would more than double annual solar capacity additions from 2027 to 2030.
Even with an ITC extension, more solar is needed to hit US clean energy targets
The clean energy tax credits in the BBB Act can’t overcome every industry barrier. Transmission and distribution constraints are an increasingly stubborn challenge for solar projects across all segments. While an ITC extension can help developers pay for interconnection upgrade costs, increased grid hosting capacity and improved grid integration are still desperately needed.
It’s critical that these and other barriers to solar deployment are addressed if the US hopes to hit President Biden’s clean energy targets. Based on our prior modeling (before the formation of the BBB Act), an extension of the ITC at 26% and the PTC at US$15/MWh results in the US electric sector reaching 55% carbon-free energy by 2030. To hit President Biden’s goal of 80% by 2030, there is a critical need for more energy storage and enhanced transmission and distribution infrastructure.


